DATA ANALYSIS
Sort through and filter critical alerts and conditions from your fleet

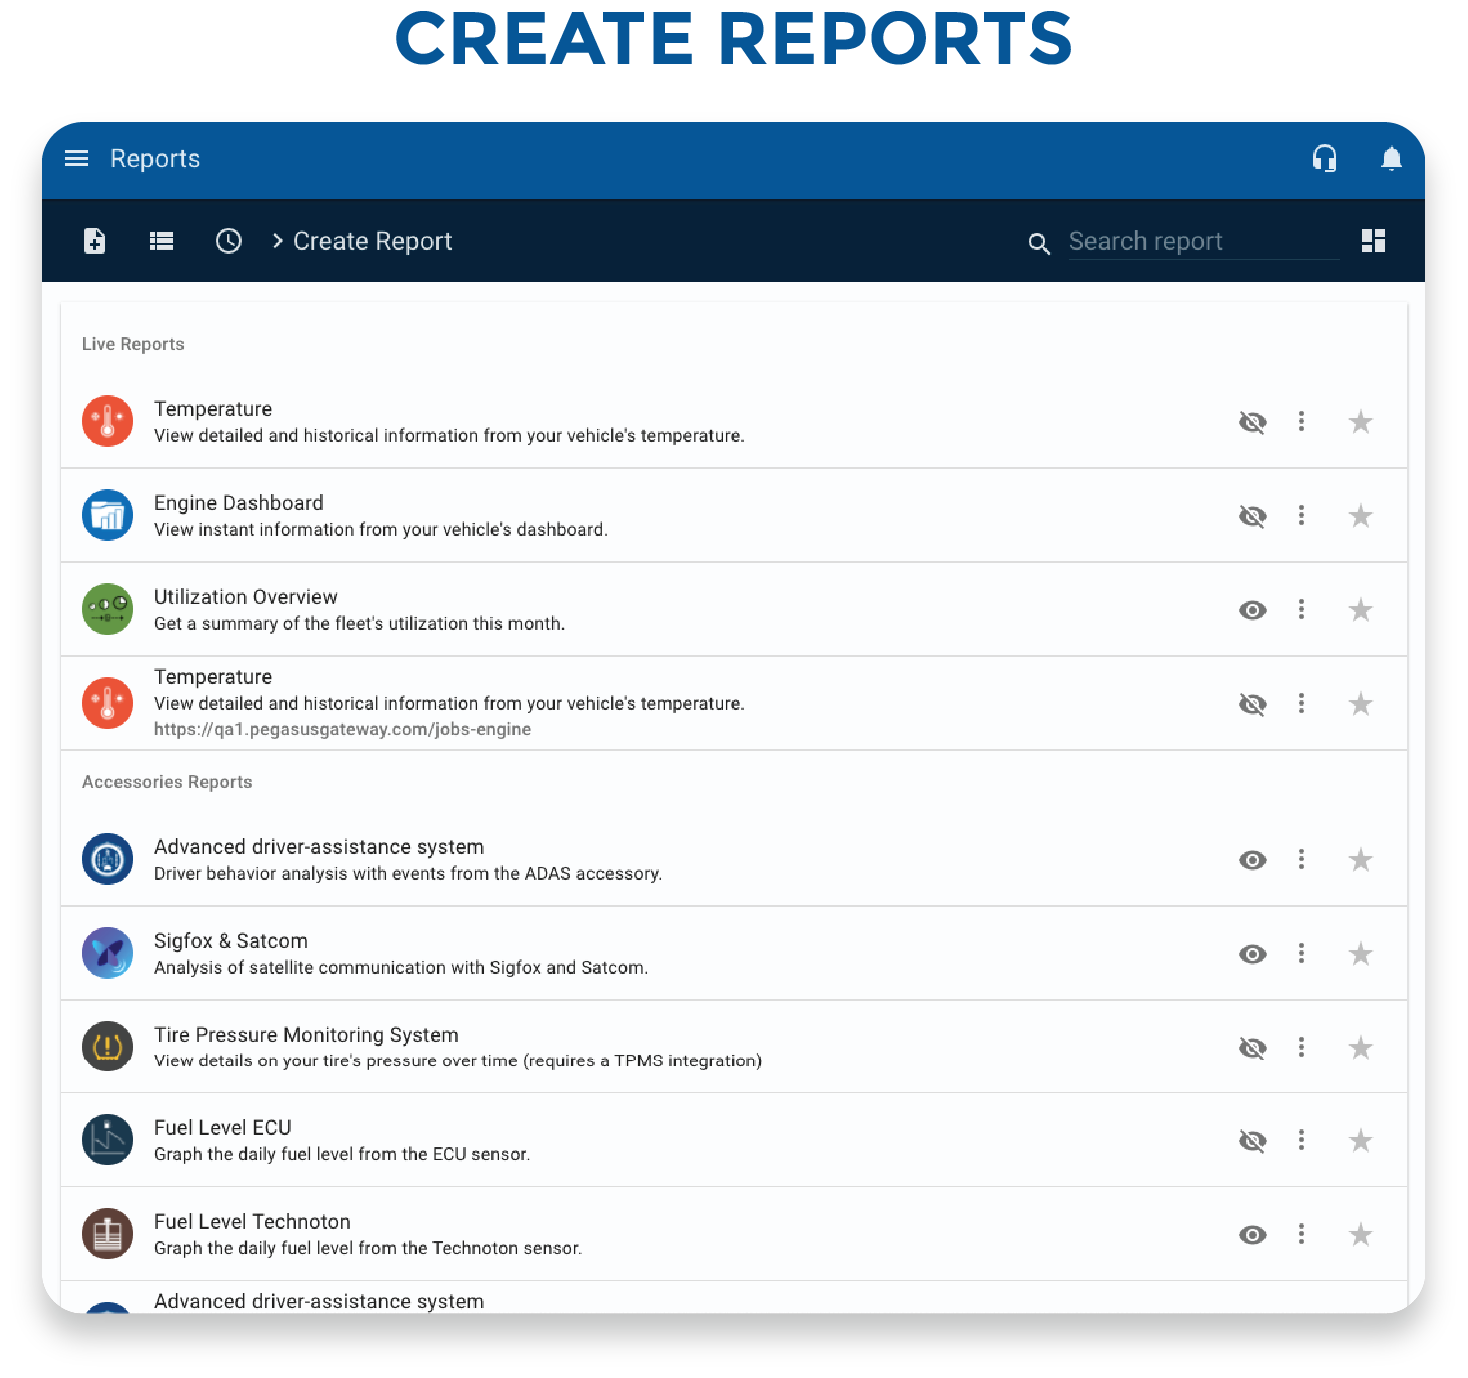
01. Create Reports
Customizable reports allow you to choose the data points that matter most to your business, such as vehicle location, speed, and fuel consumption
You can also choose the report format that works best for you, whether it’s a table, chart, or graph.
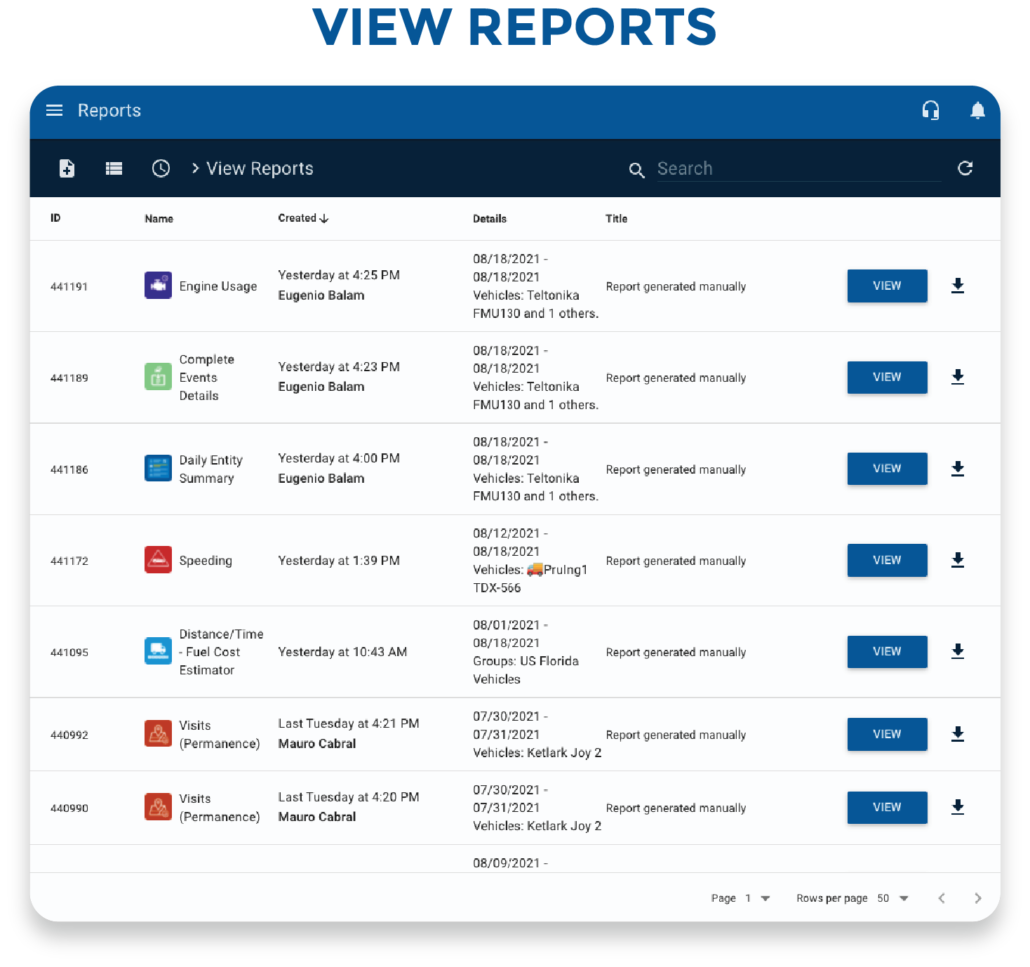
02. View Reports
Once you’ve created a report, you can view it at any time through our user-friendly interface. Our reports are easy to read and provide valuable insights into your fleet’s performance.
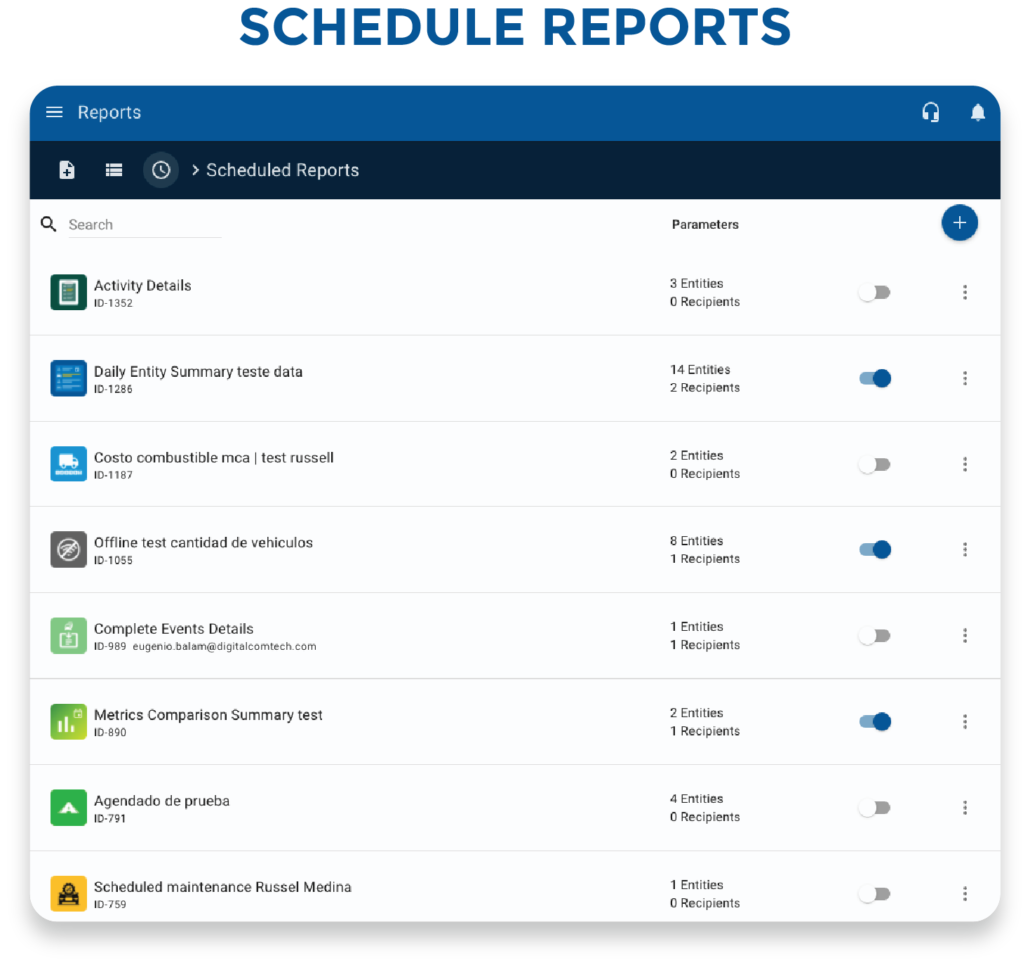
03. Schedule Reports
If you want to receive reports on a regular basis, you can schedule them to be sent to your inbox automatically.
This means you can stay on top of your fleet’s performance without having to log in to our platform every day.
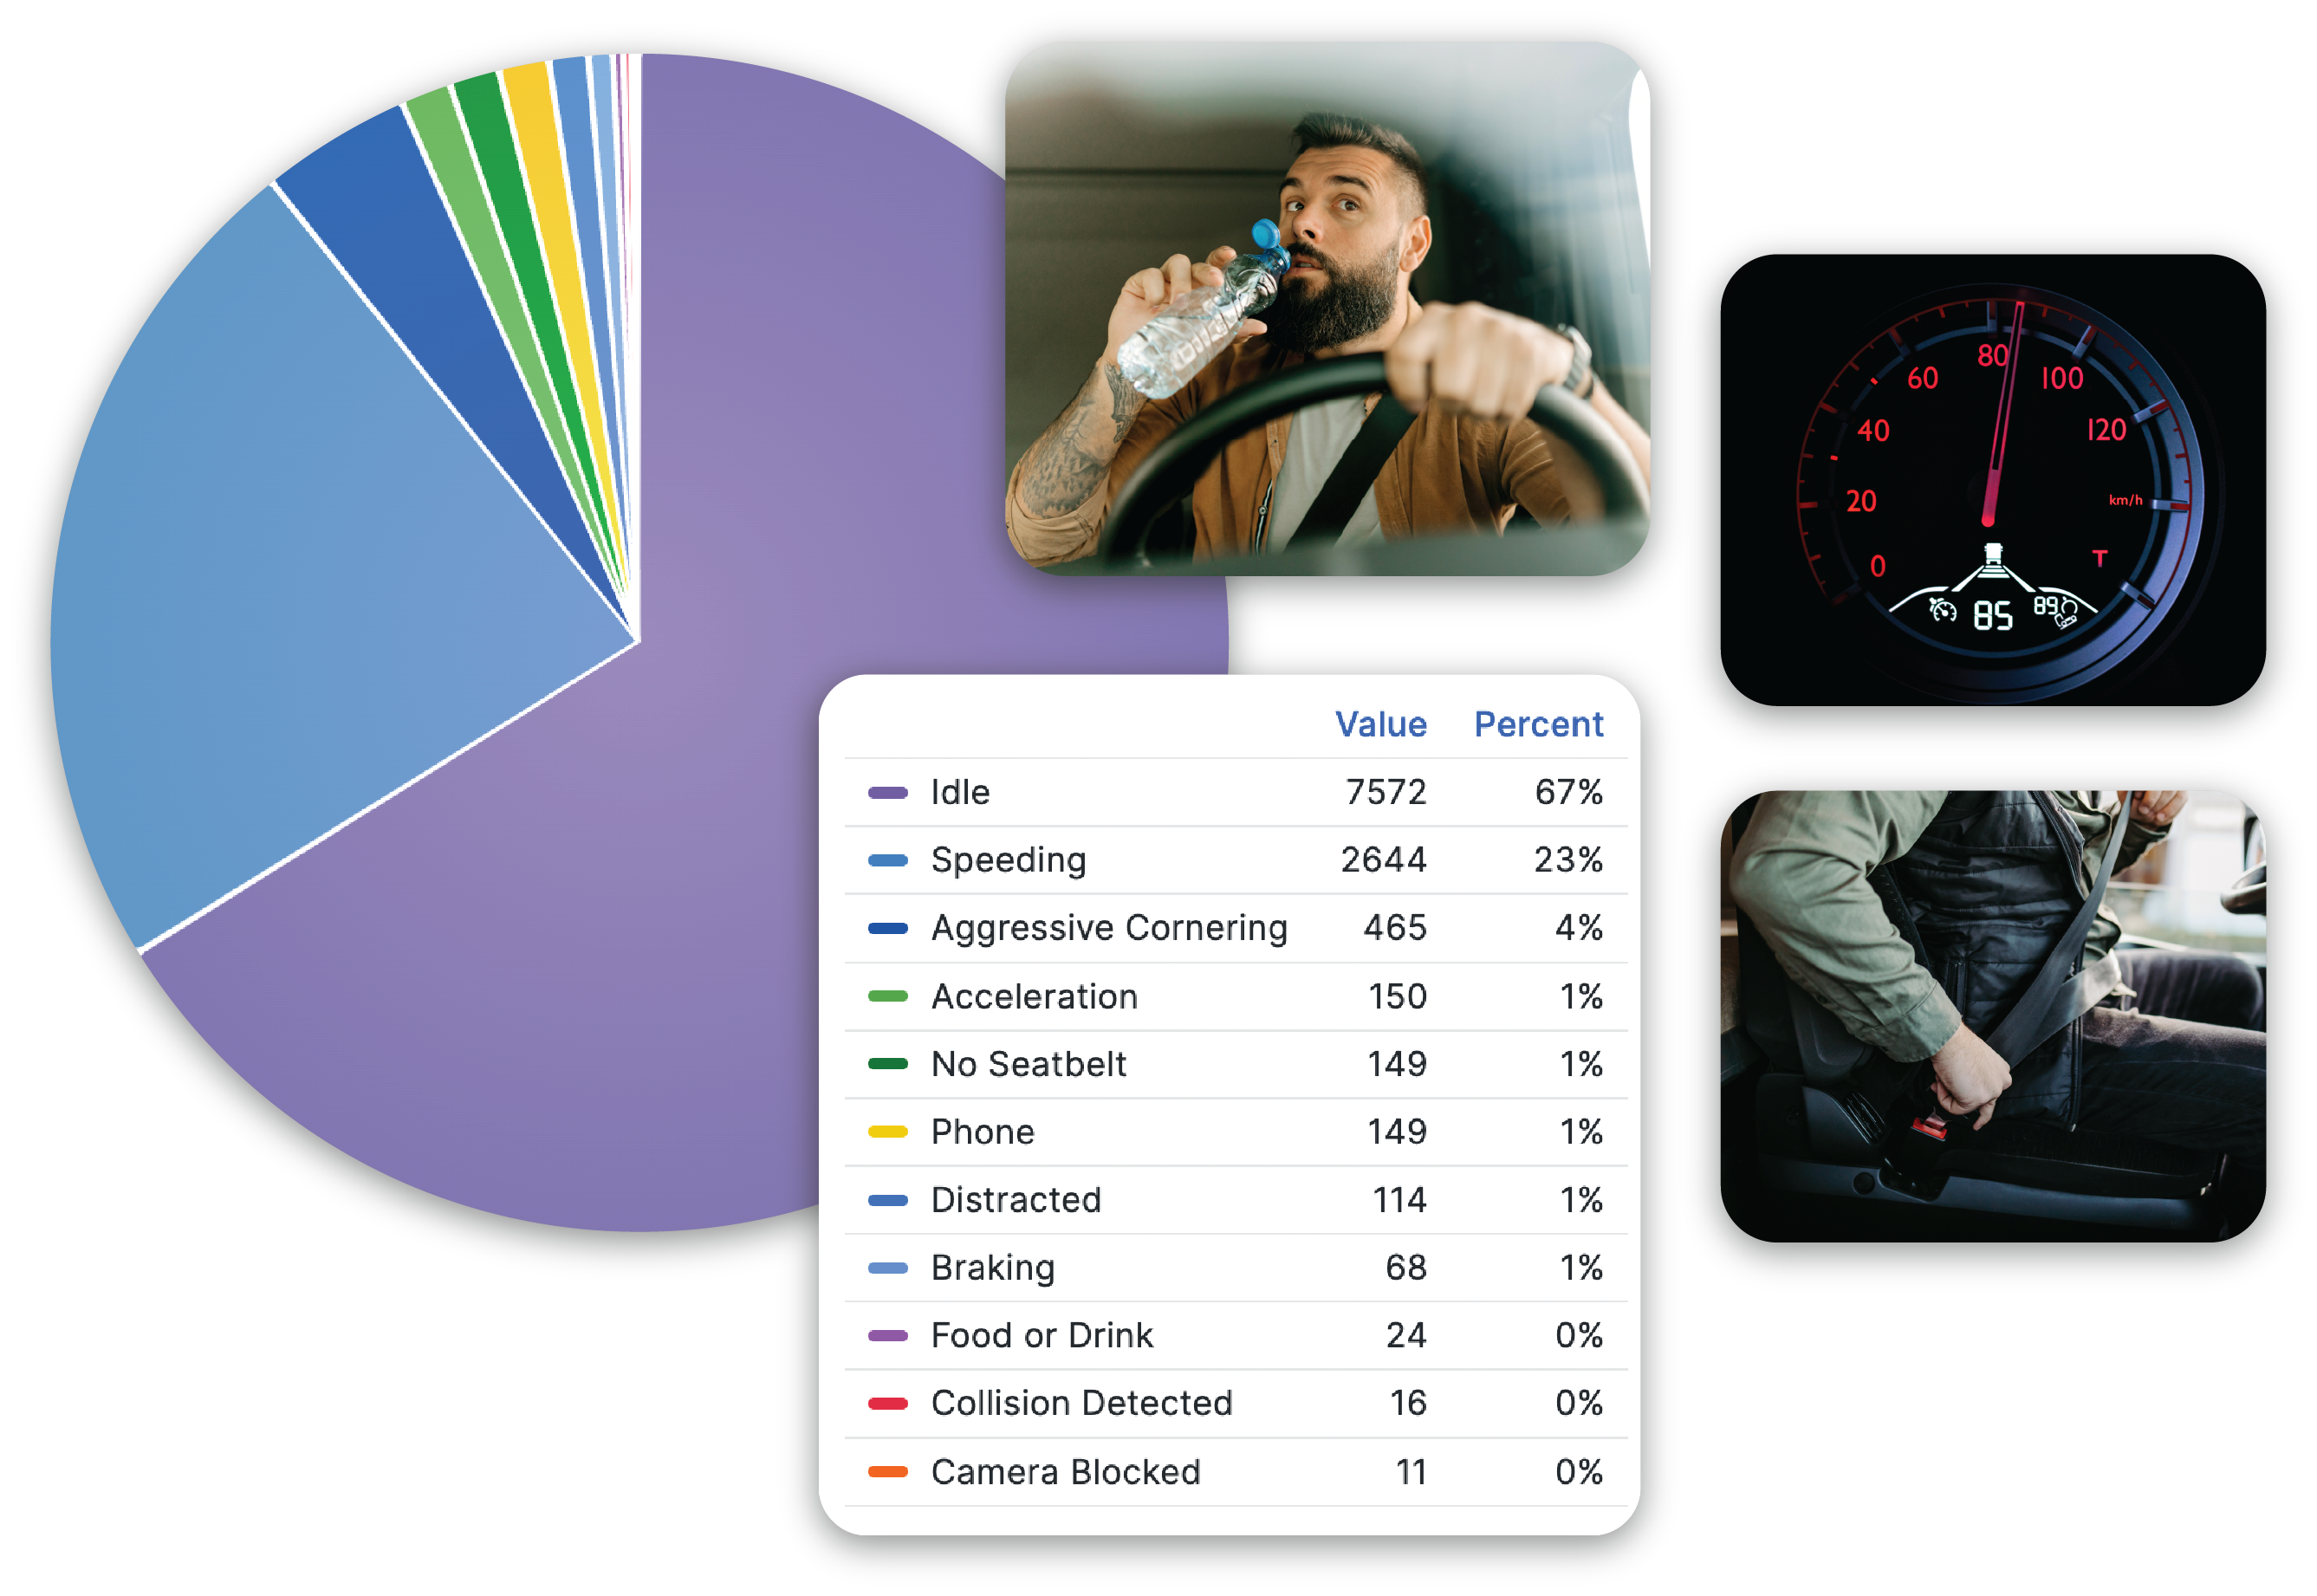
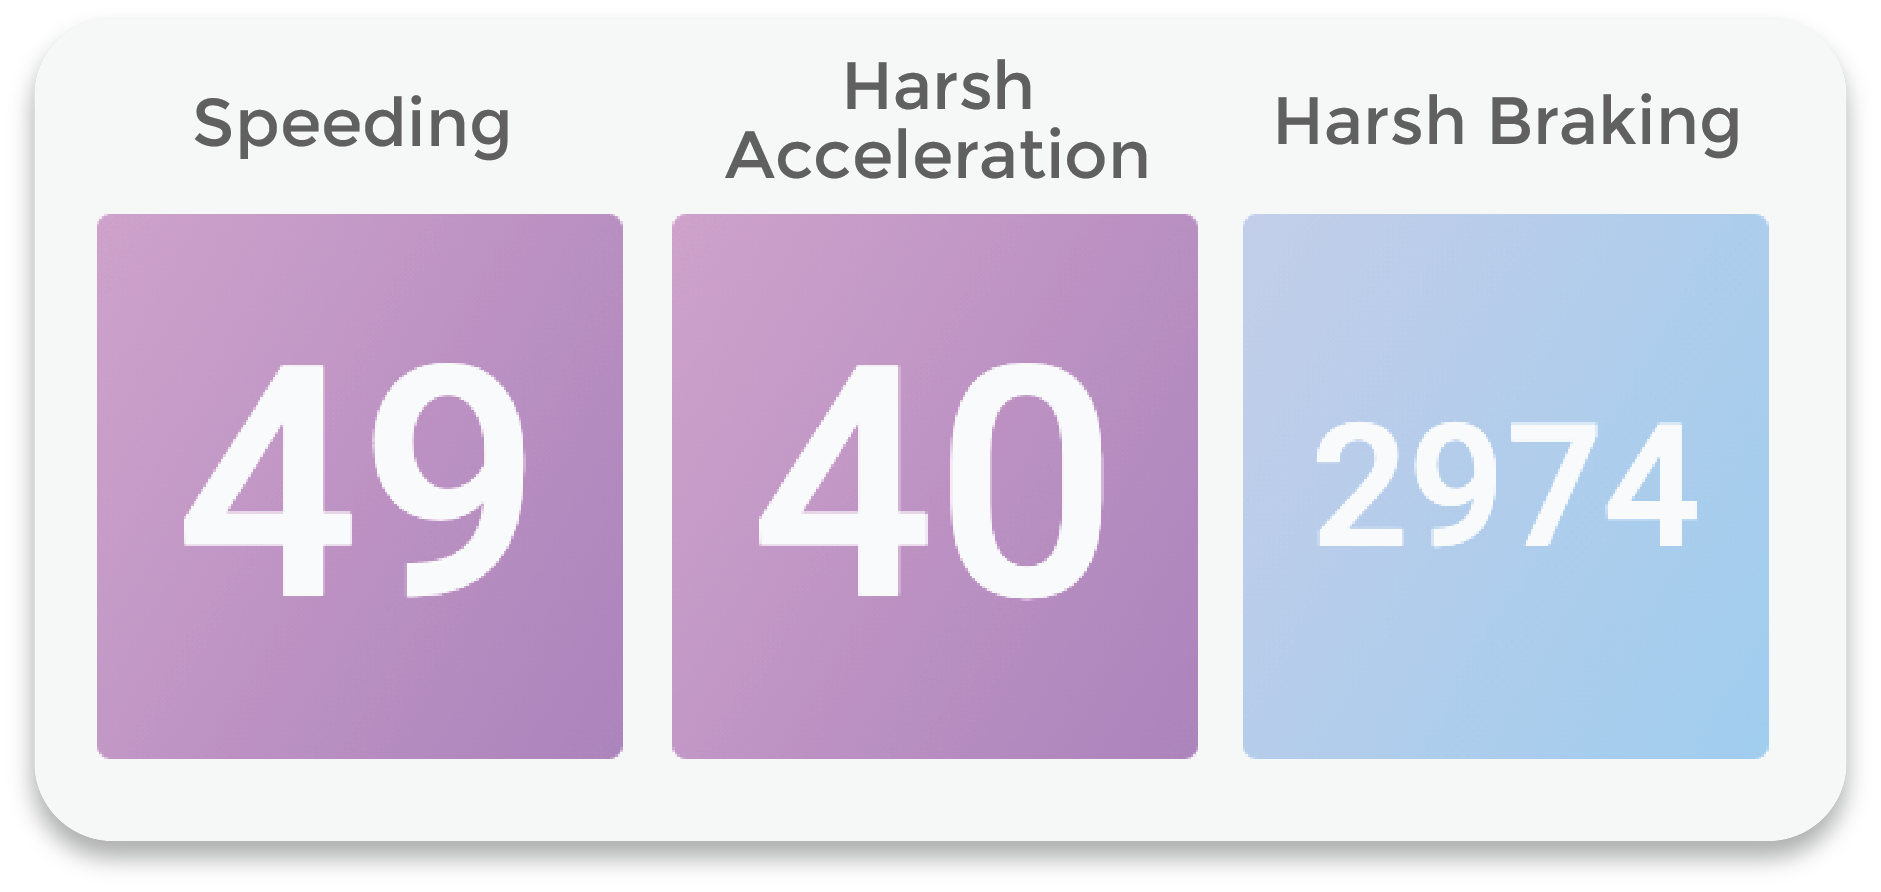
Safe Driving Indicators
Understand your fleet’s behavior and reduce liability. If you know how your vehicles behave on the road, you can take measures to diminish your risk factors.
Global Fleet Efficiency Indicators
How you manage your fleet can affect your income. By making a few adjustments, you can maximize the efficiency of your fleet, reducing costs and maintenance times.
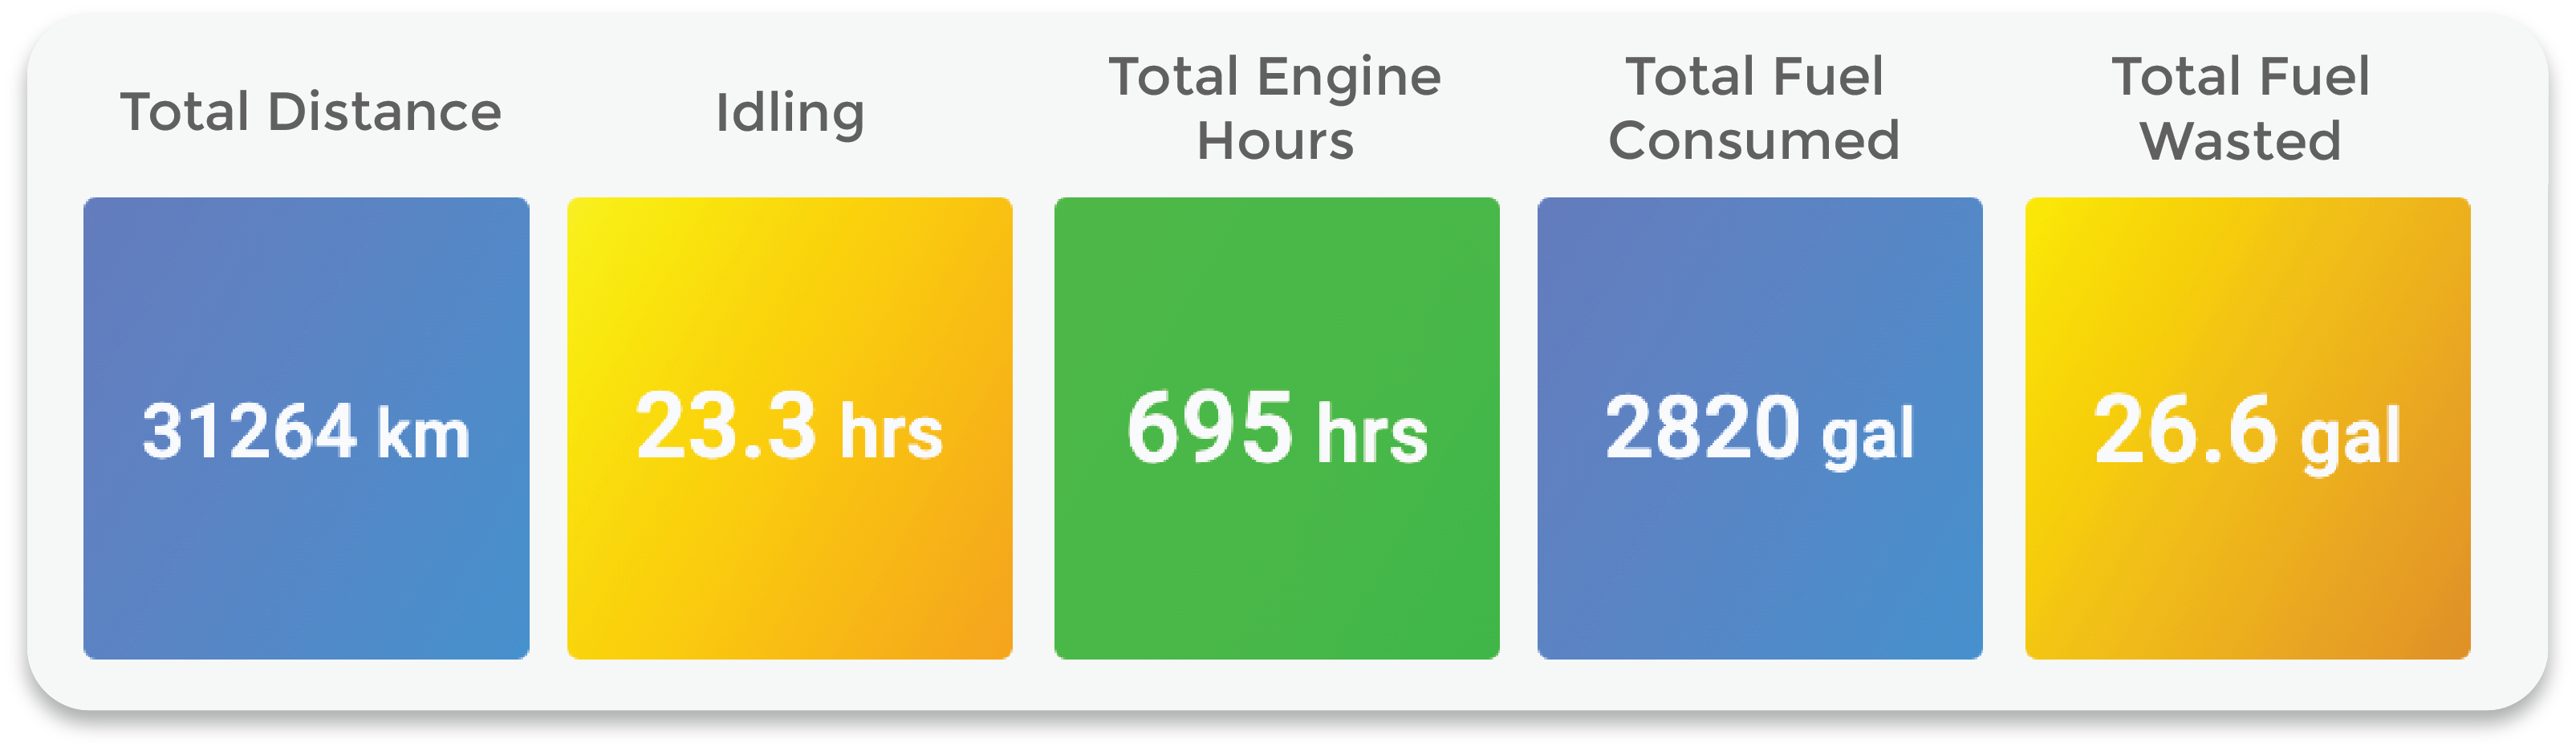
Detailed Fleet Efficiency Indicators
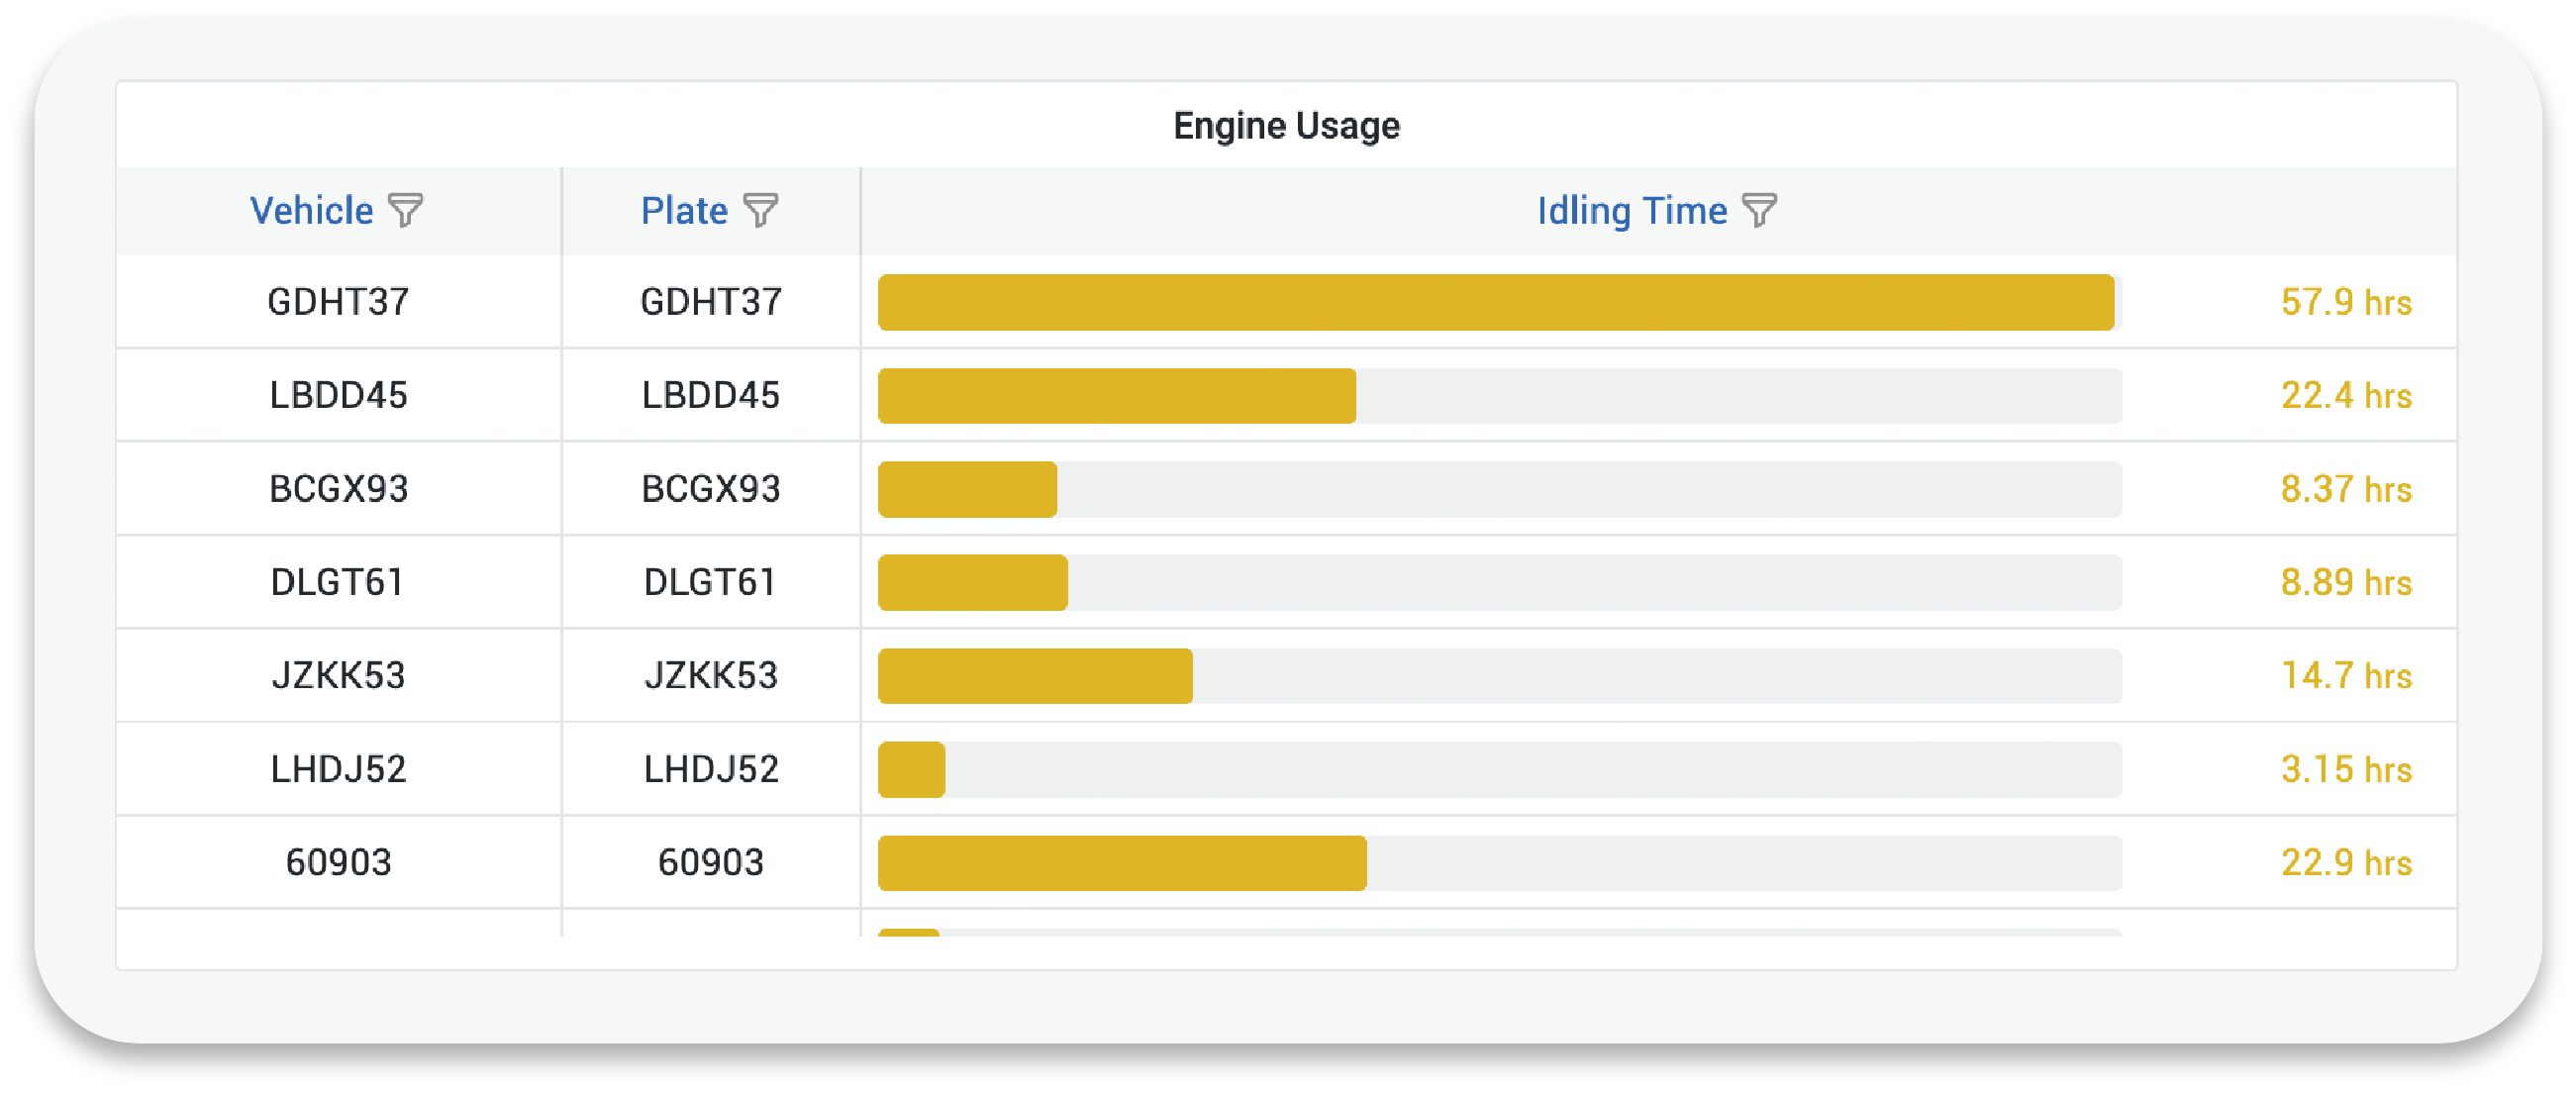
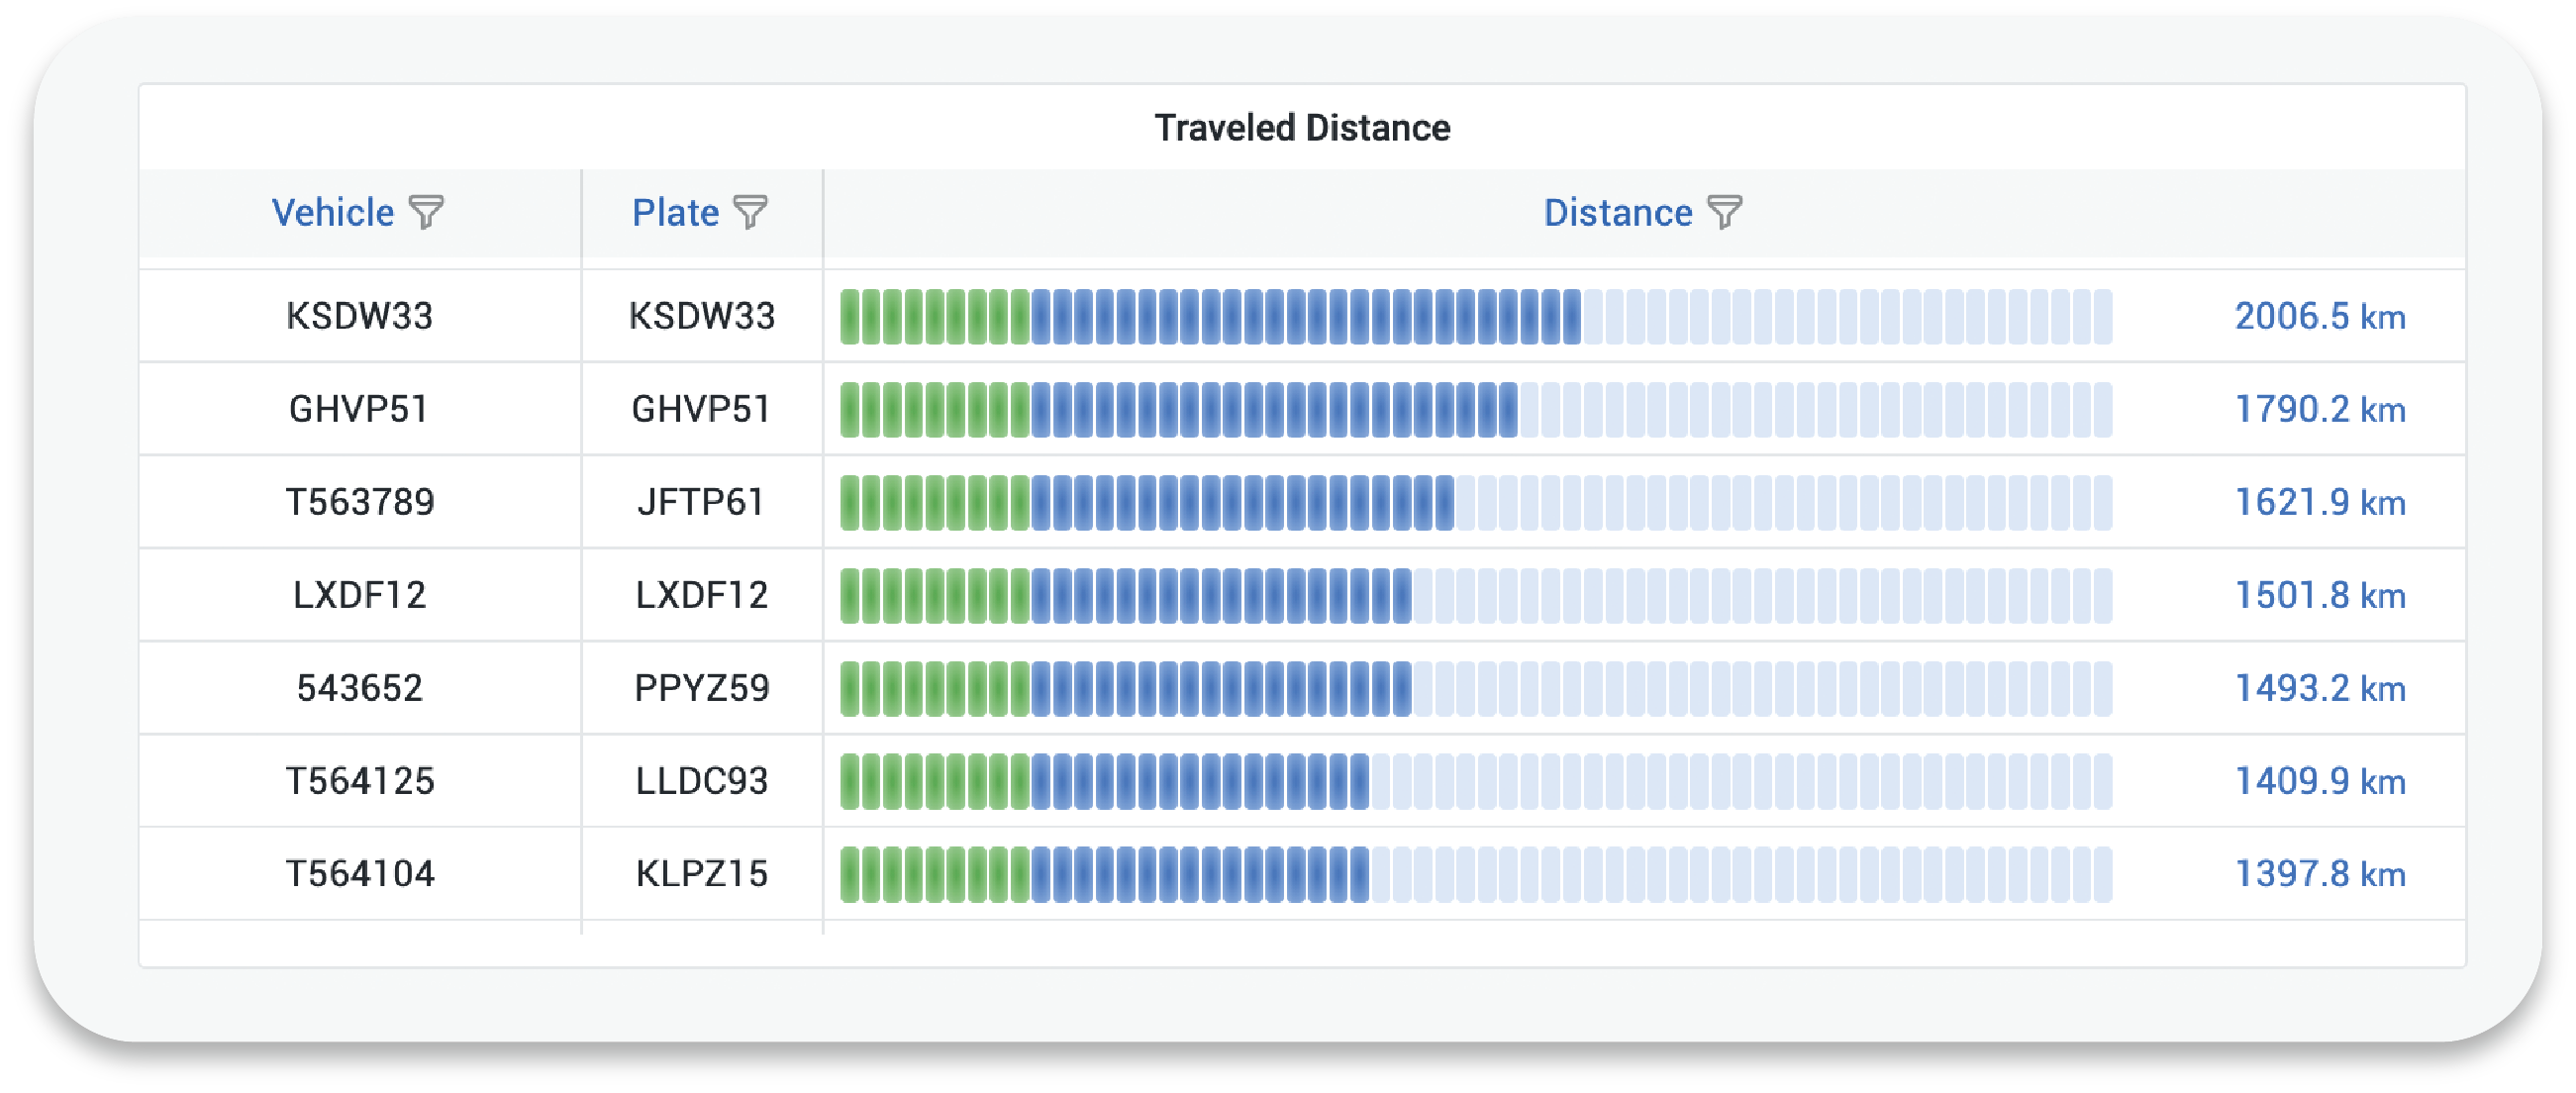
Quickly find and identify potential problems such as wasted fuel due to unnecessary idling. Compare traveled distance and fuel consumption to single out the least efficient vehicles. Find speeding vehicles that may become a potential liability. Keep track of your machinery engine hours, to help depreciate assets and schedule maintenance.
ENGINE USAGE WHILE IDLING
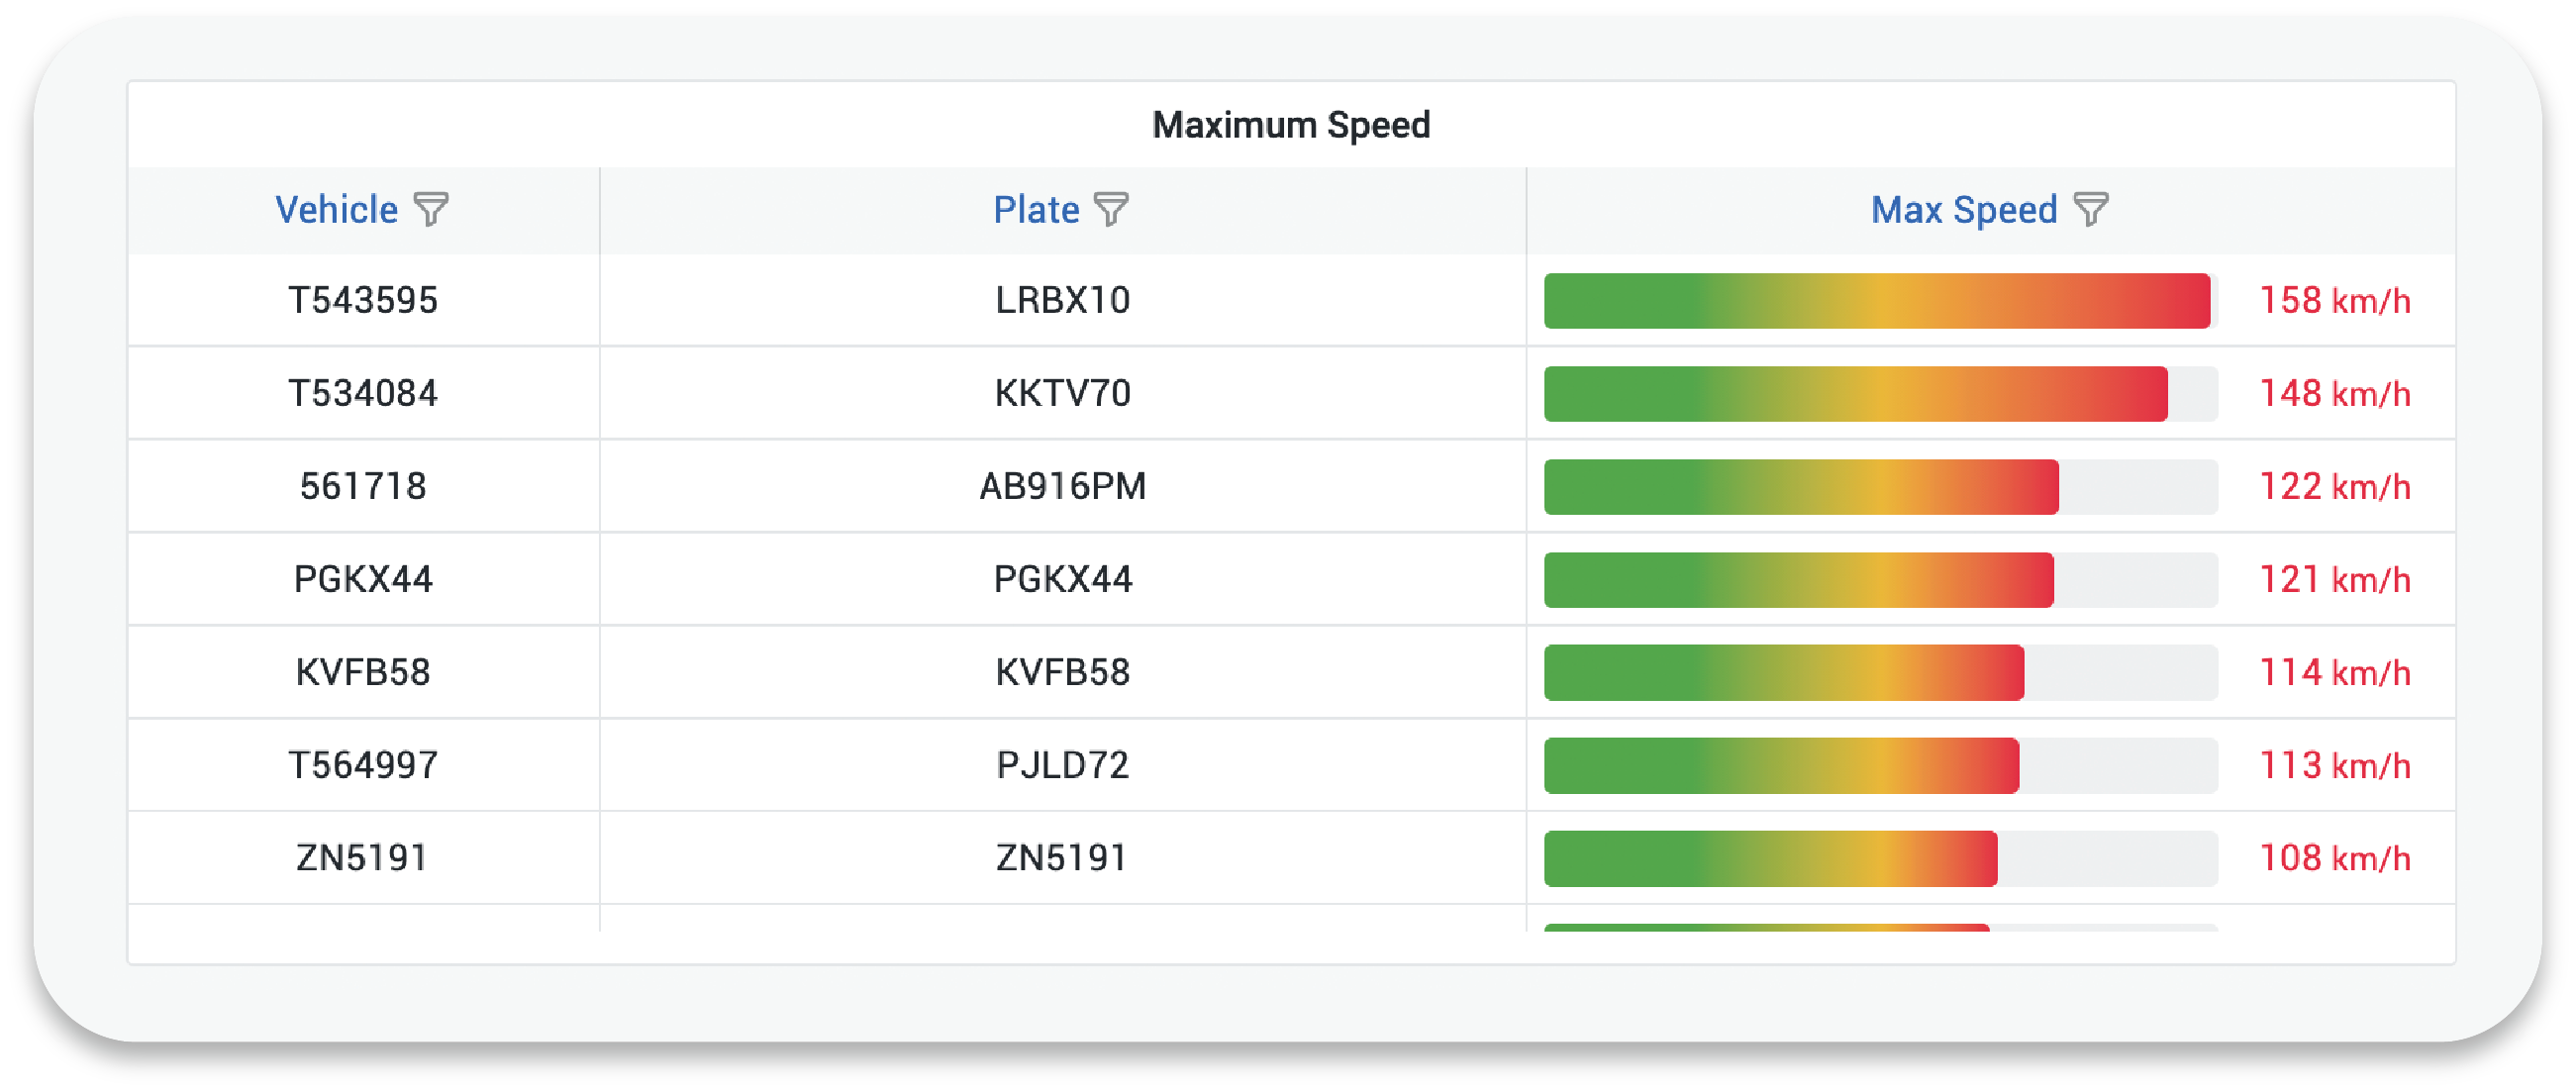
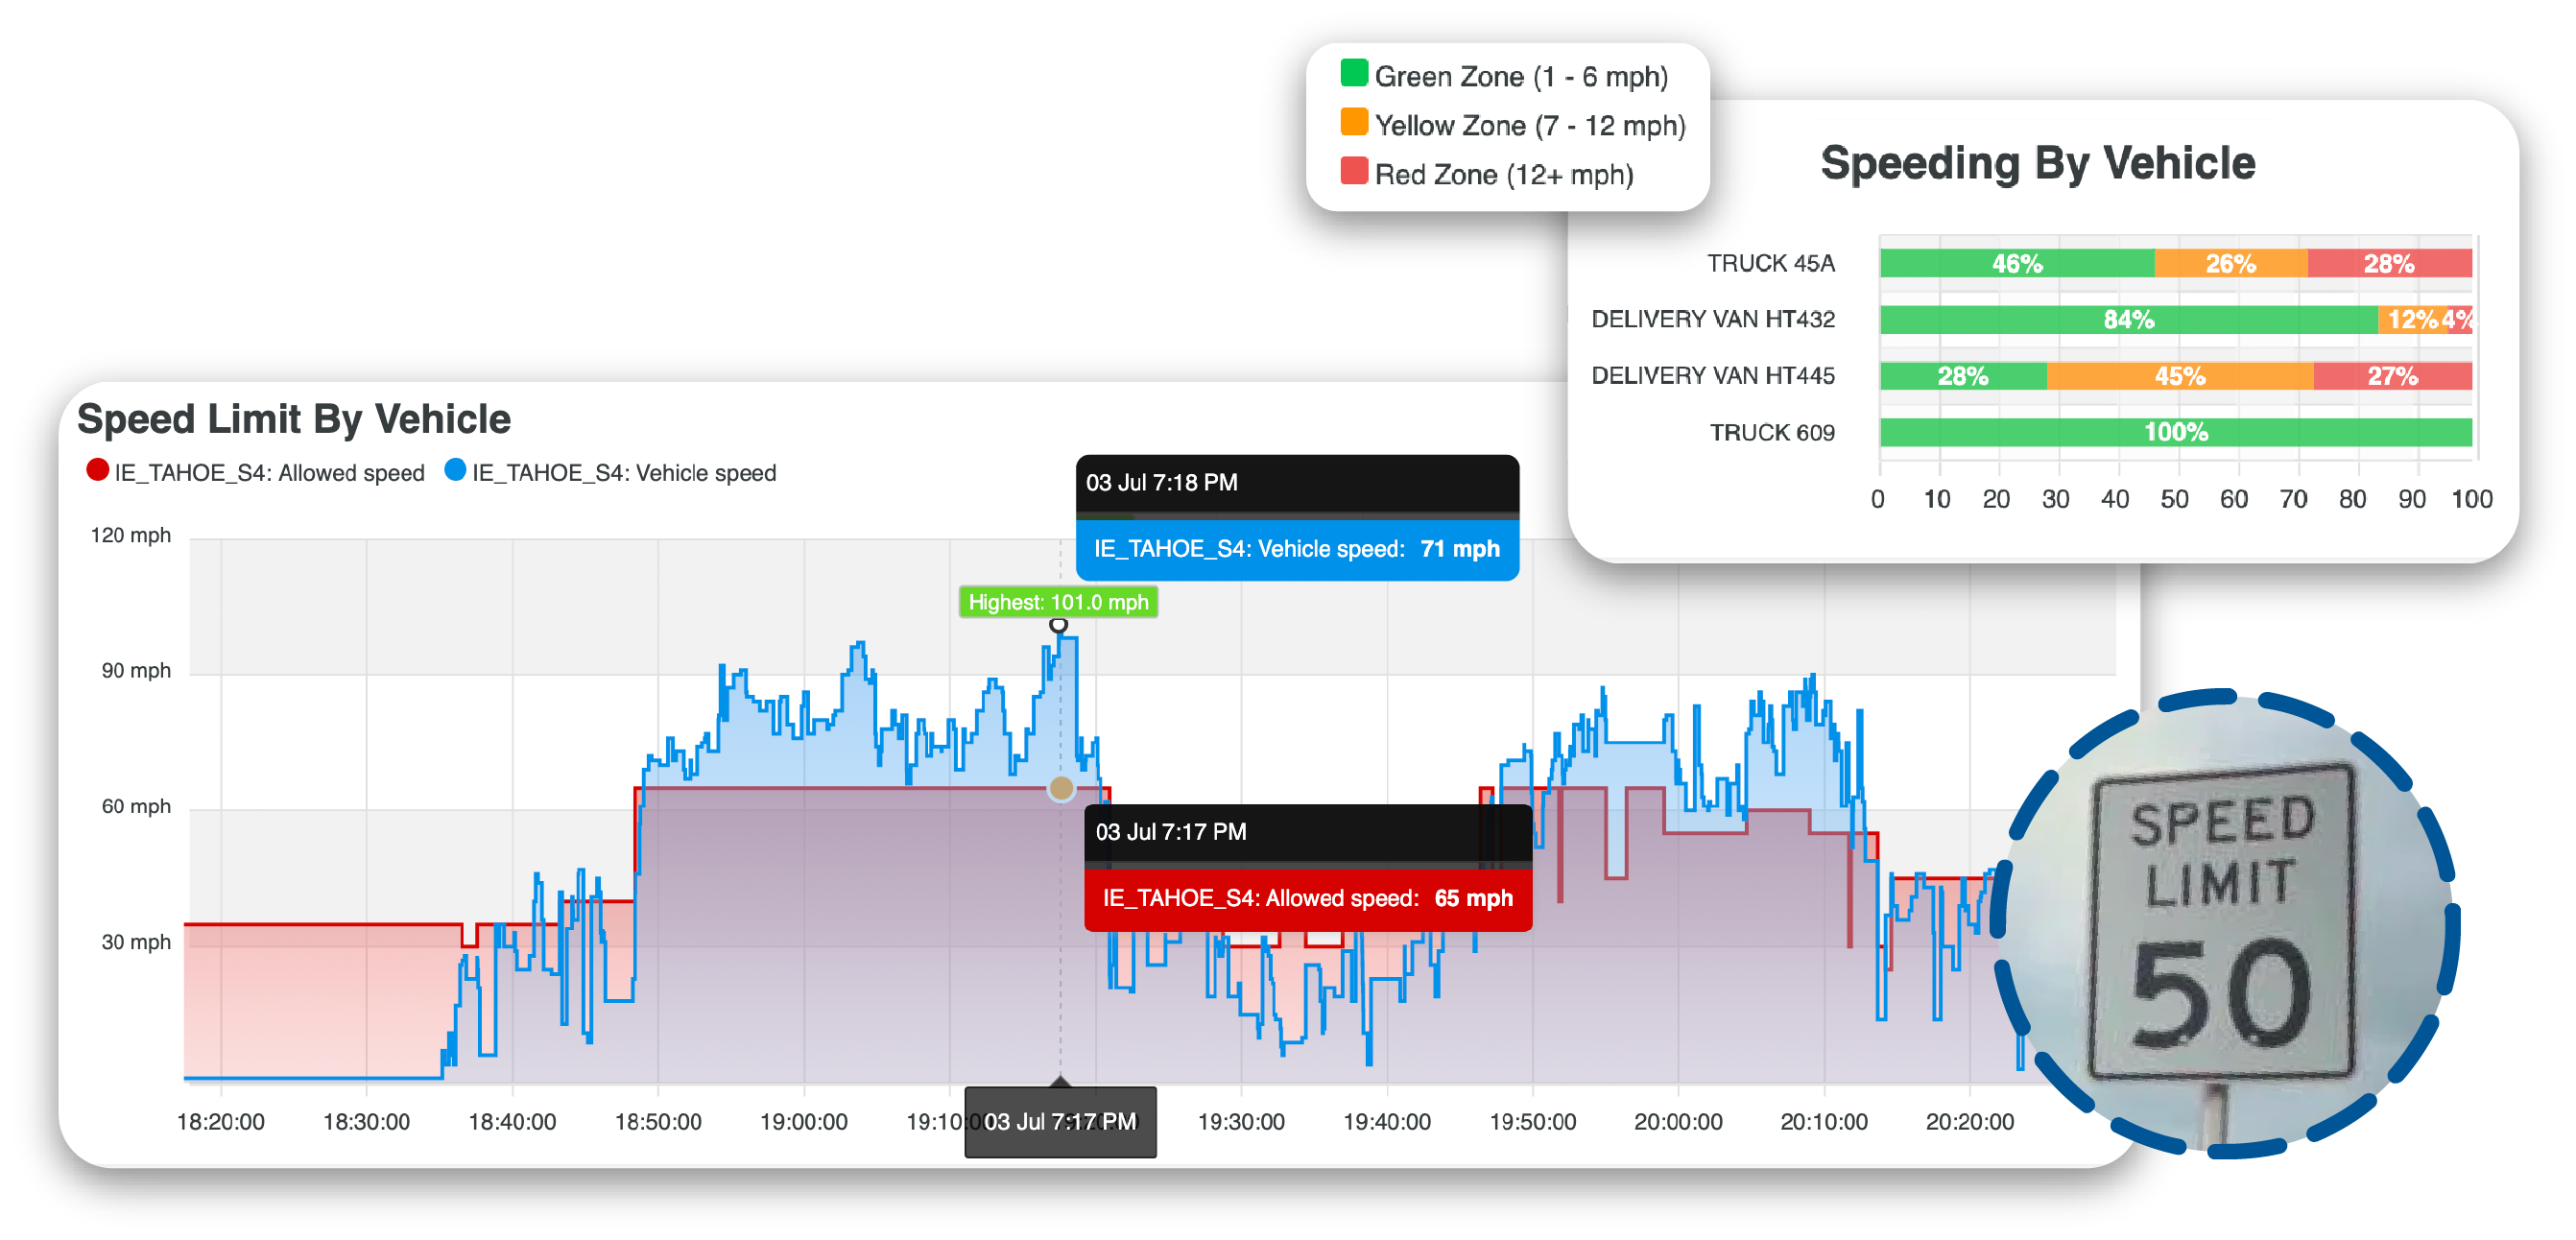
MAXIMUM SPEED
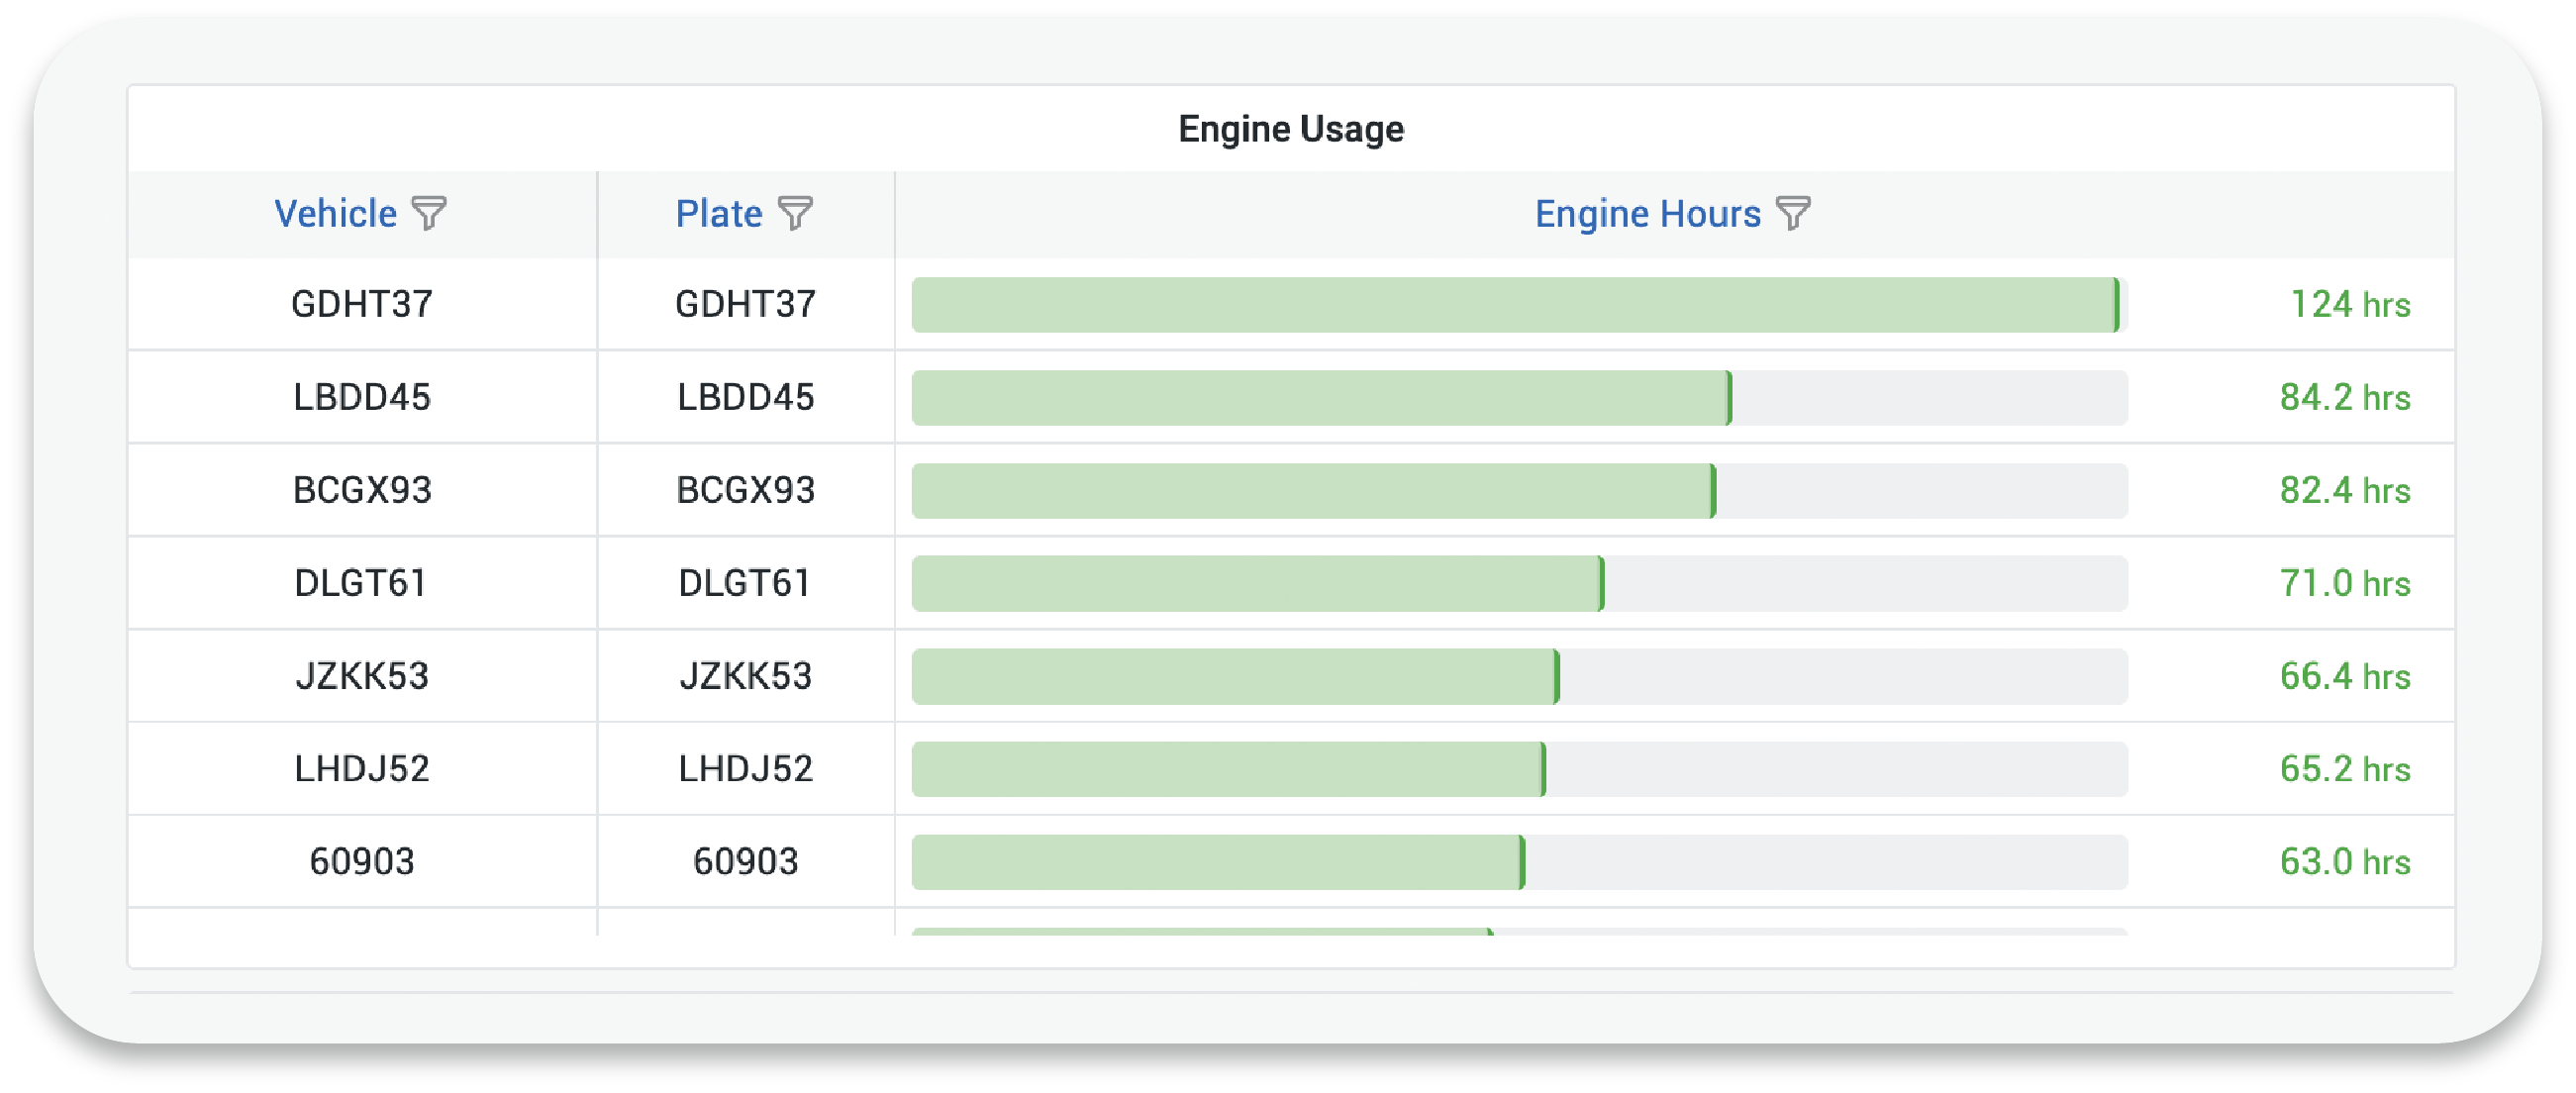
ENGINE USAGE
TRAVELED DISTANCE
Real-time Tracking
Real-time monitoring of all your important assets, as well as other useful information such as route state, fuel levels, unattended alerts, engine error codes, and more!
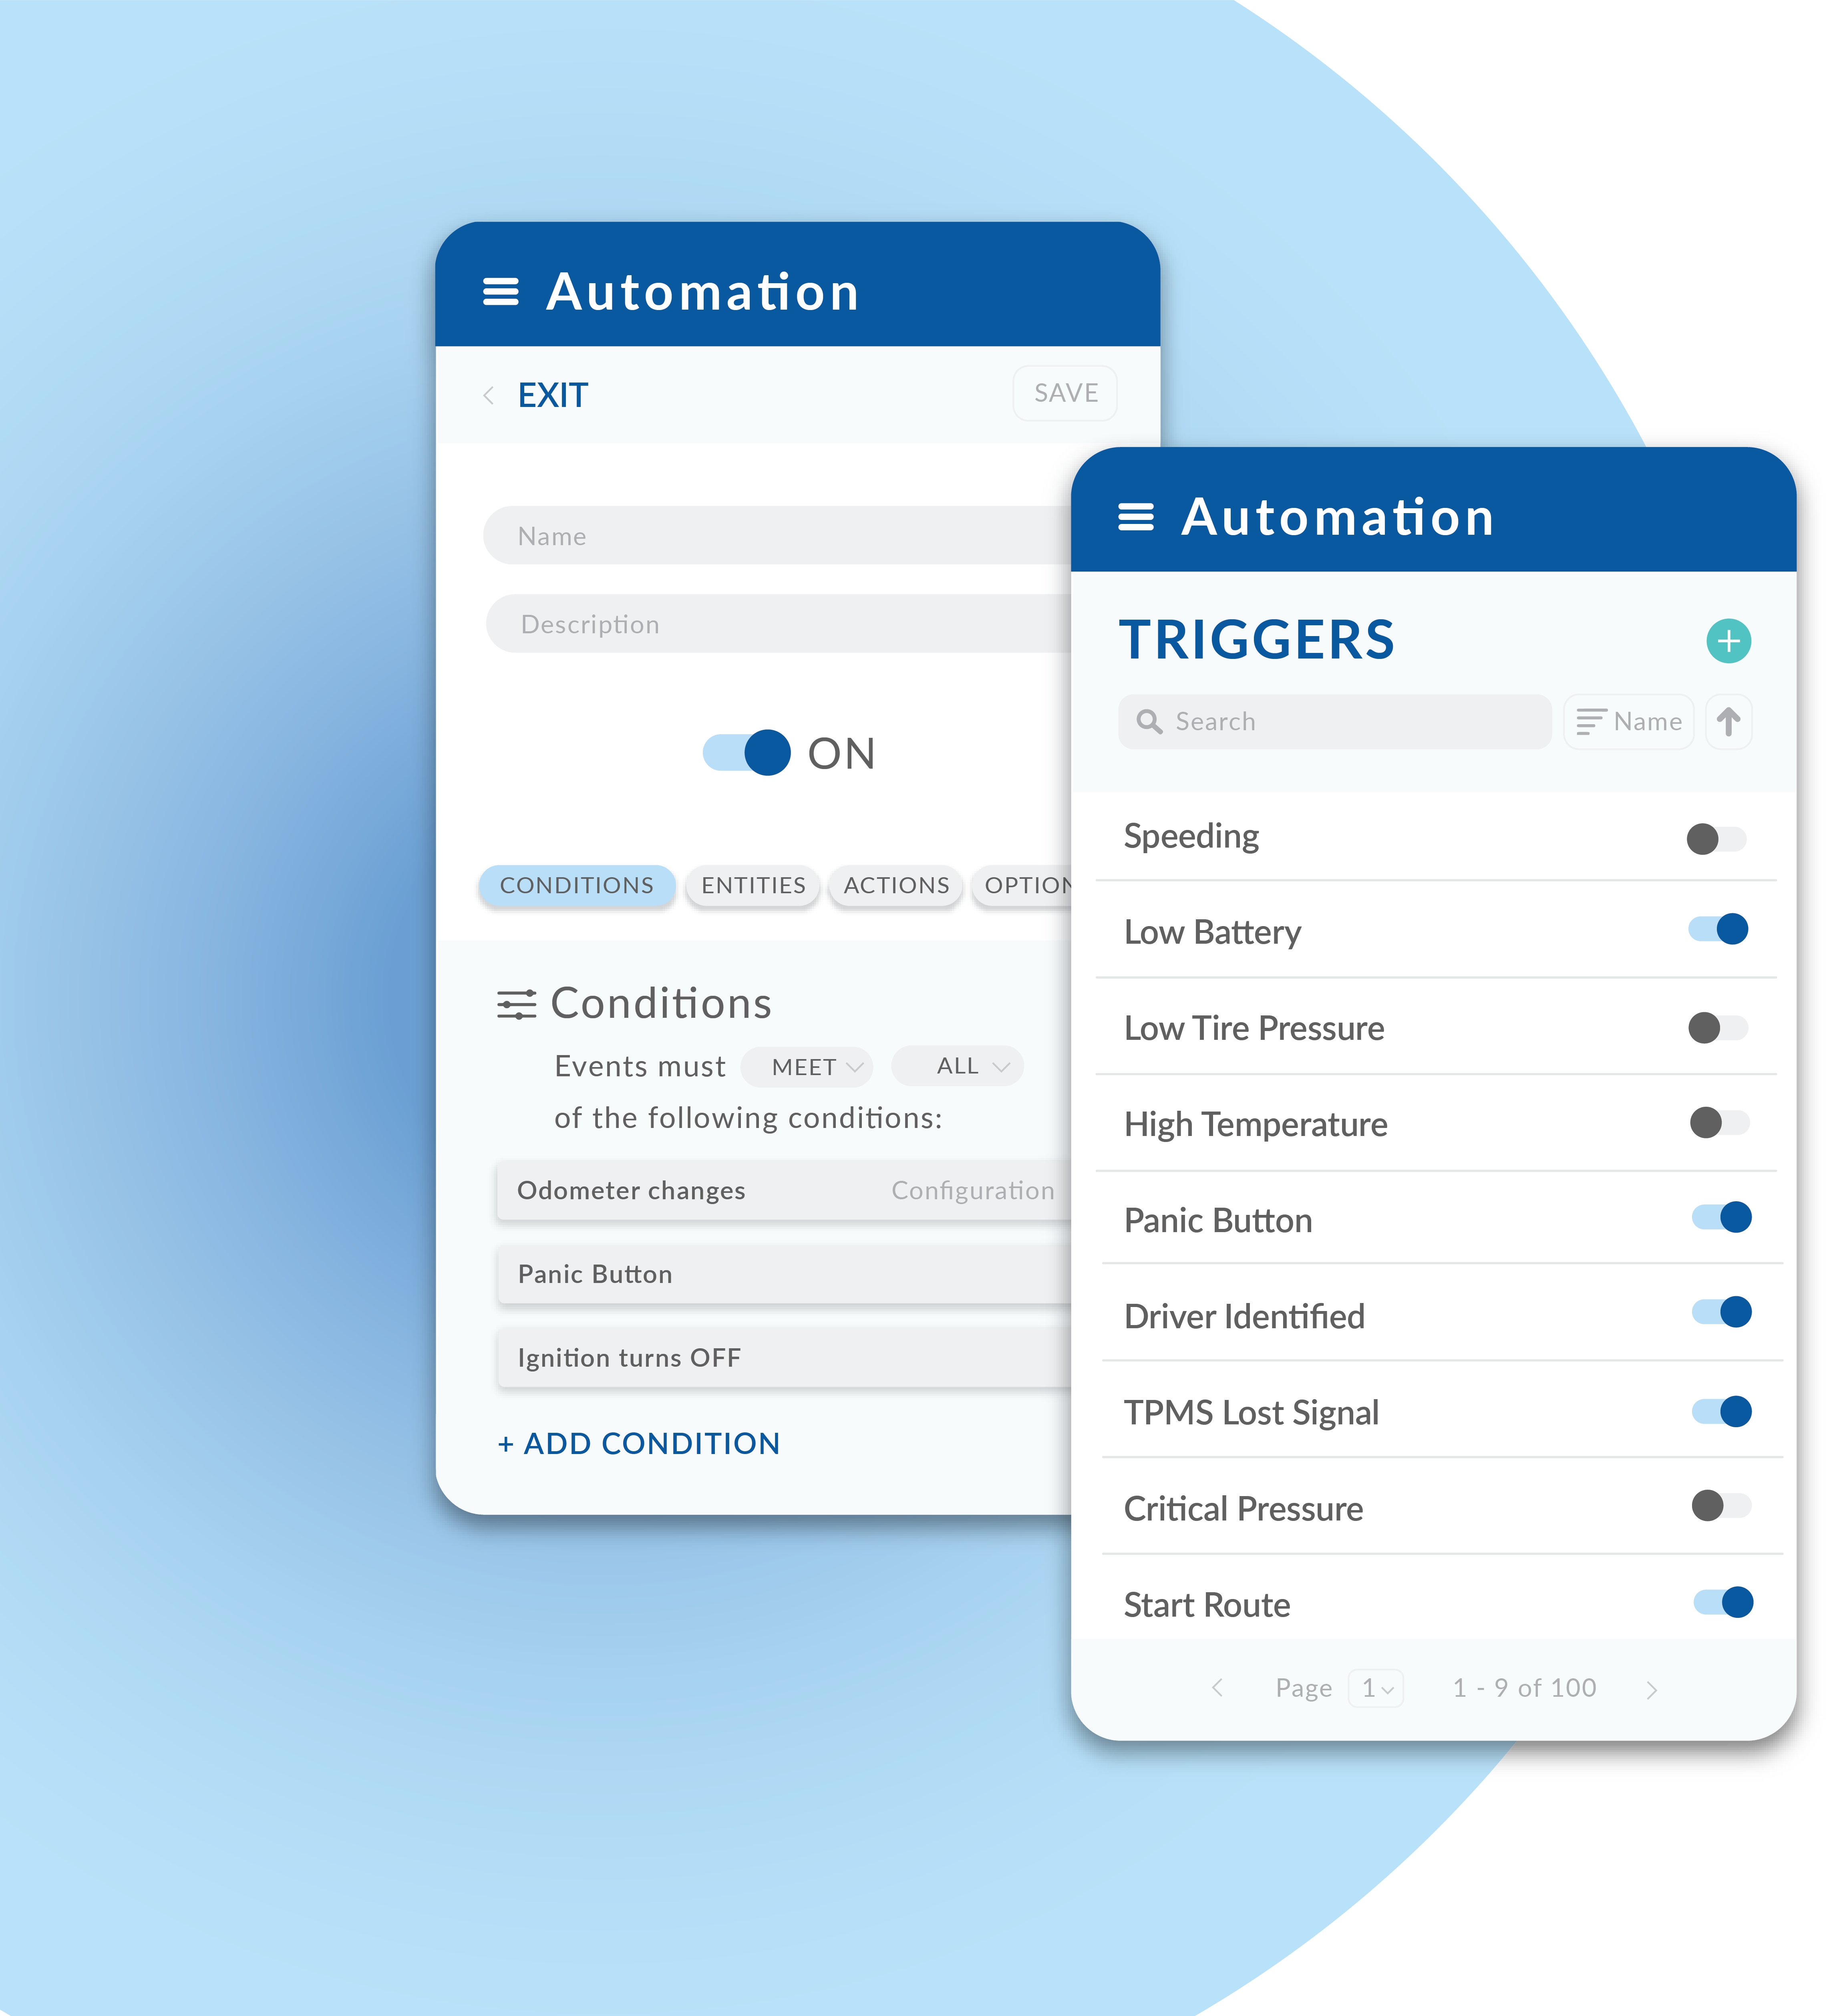
Triggers & Automation
The ability to combine any condition for events reported by any device and perform actions over them.
The actions performed by the triggers allow you to expand the integration of the Syrus device to any external accessory or device that supports APIs.
Posted Speed Limit Reports
See driver speed performance compared to the posted speed limit, to get a better idea of how drivers are performing and what can be done to improve it.
Safety Dashboard
Discover how our dashboards empower you to proactively monitor fleet safety trends and optimize coaching efforts.
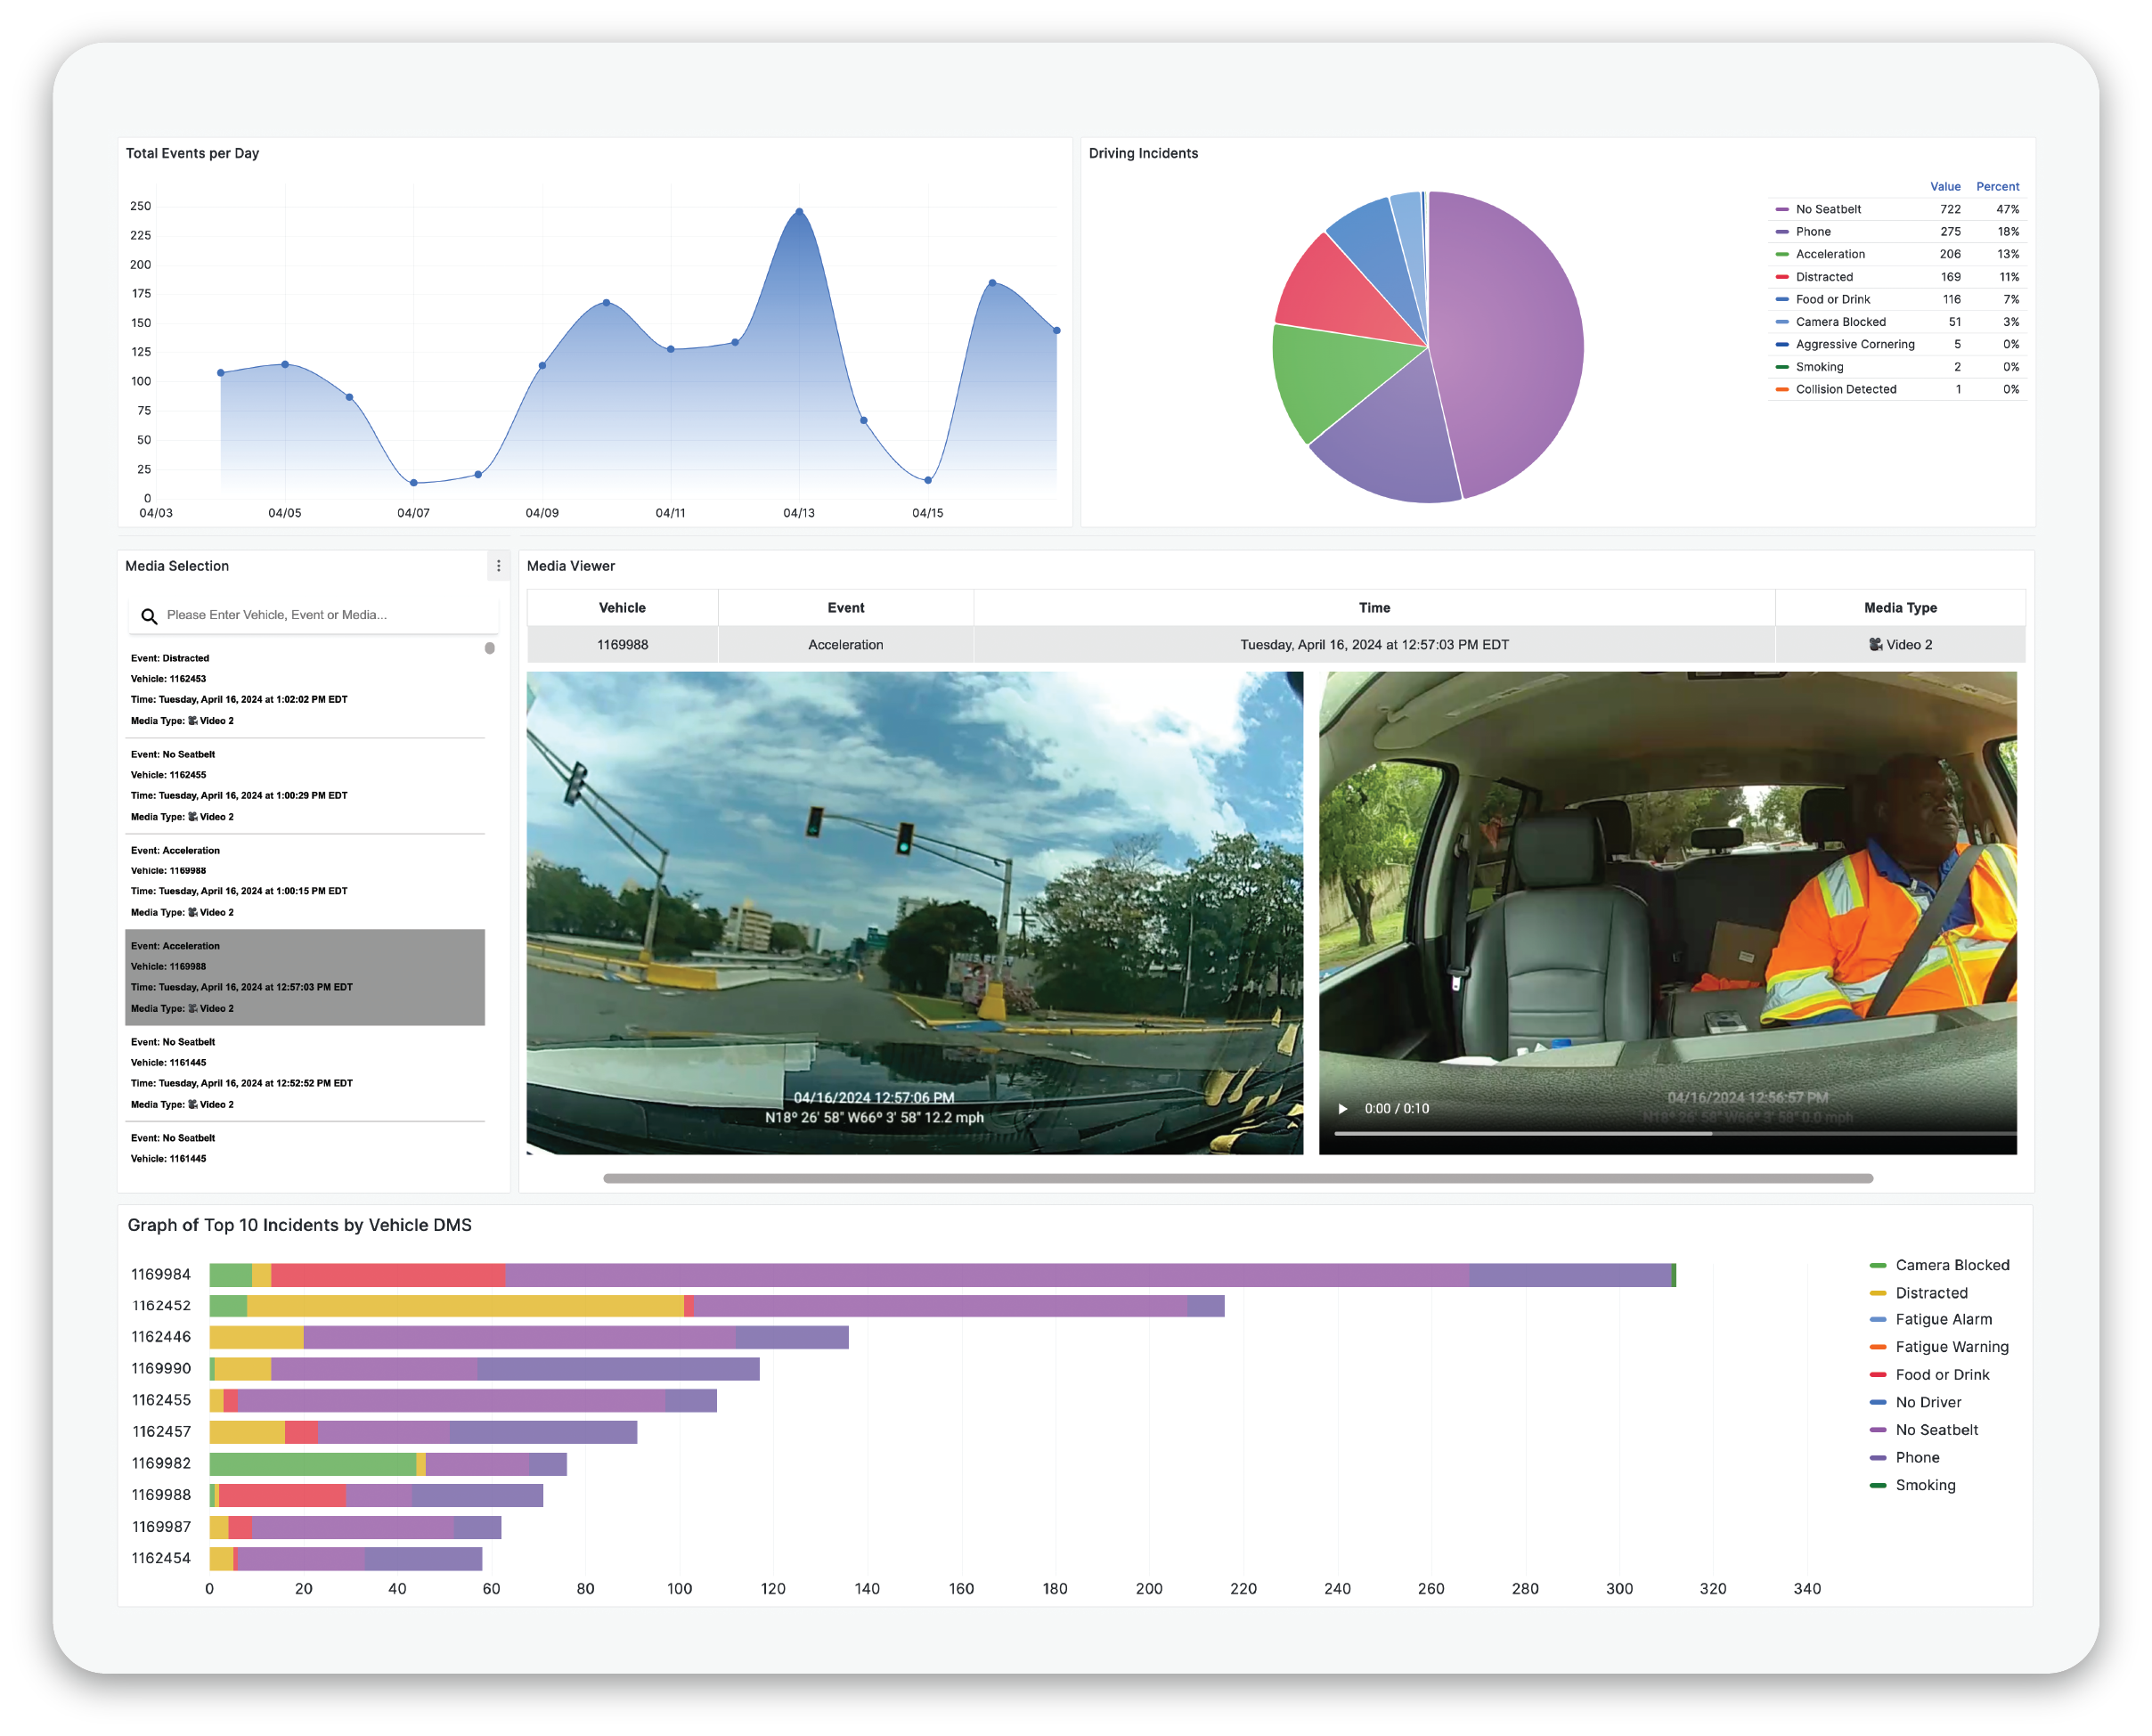
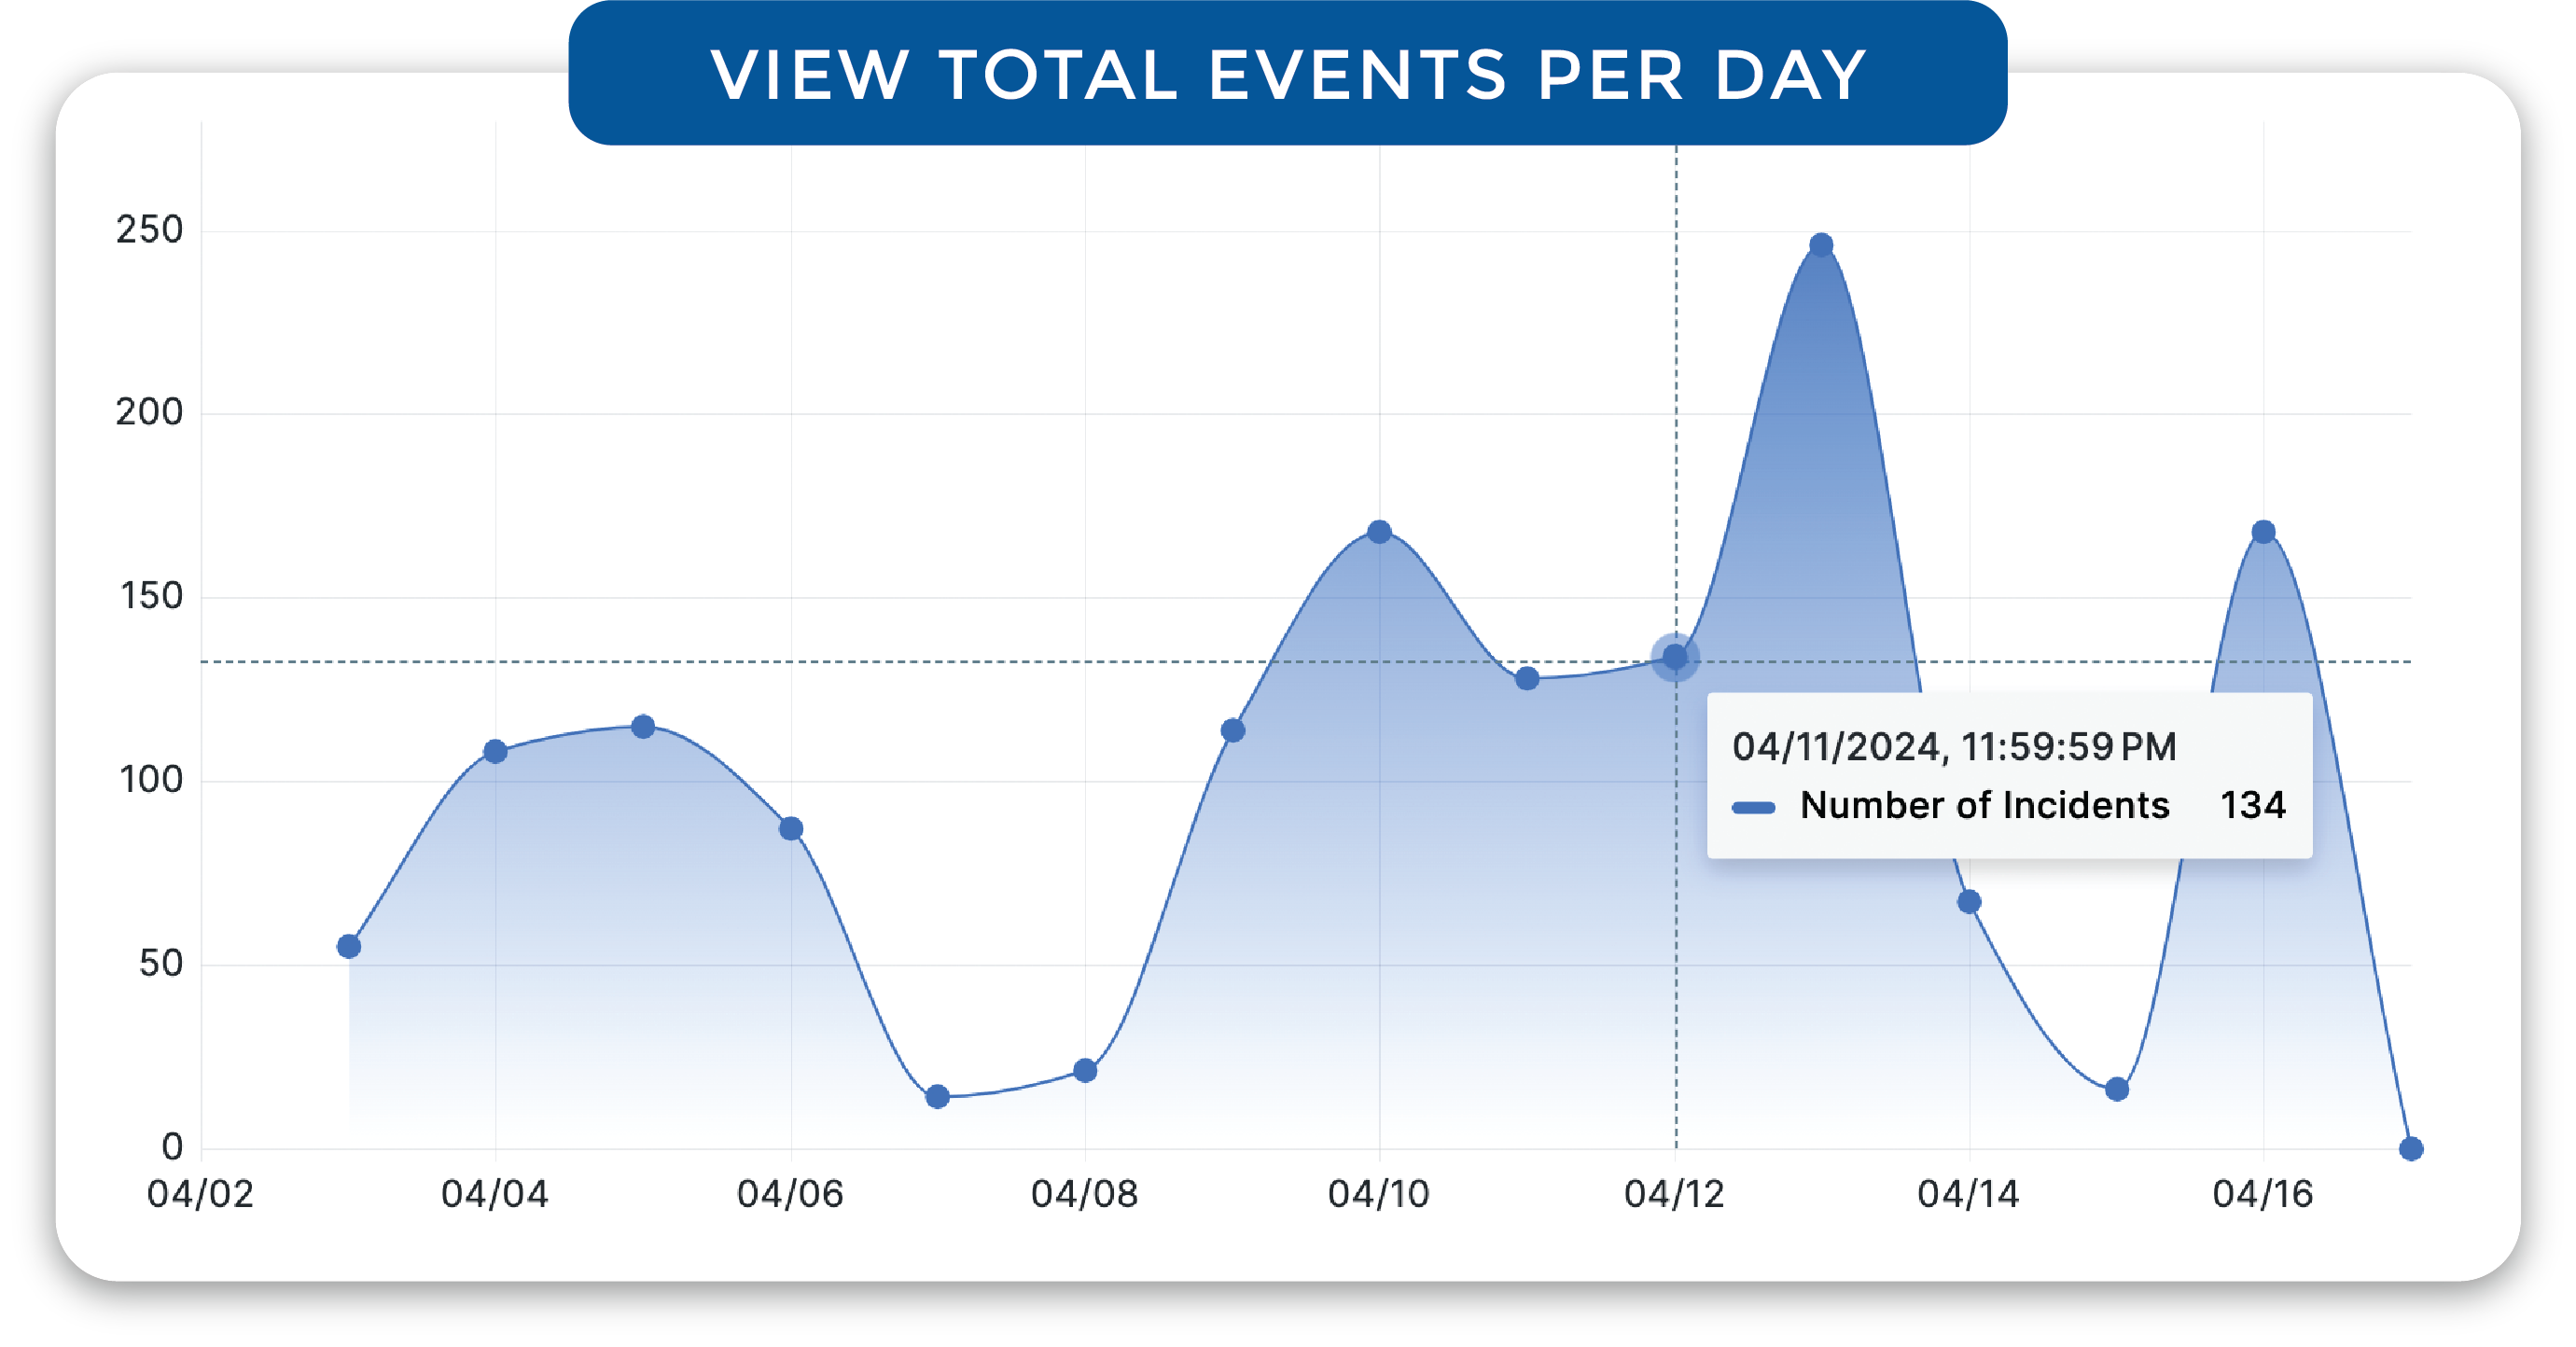
Real-Time Insights
Track daily events effortlessly, enabling you to stay ahead of risks and take preventive actions.
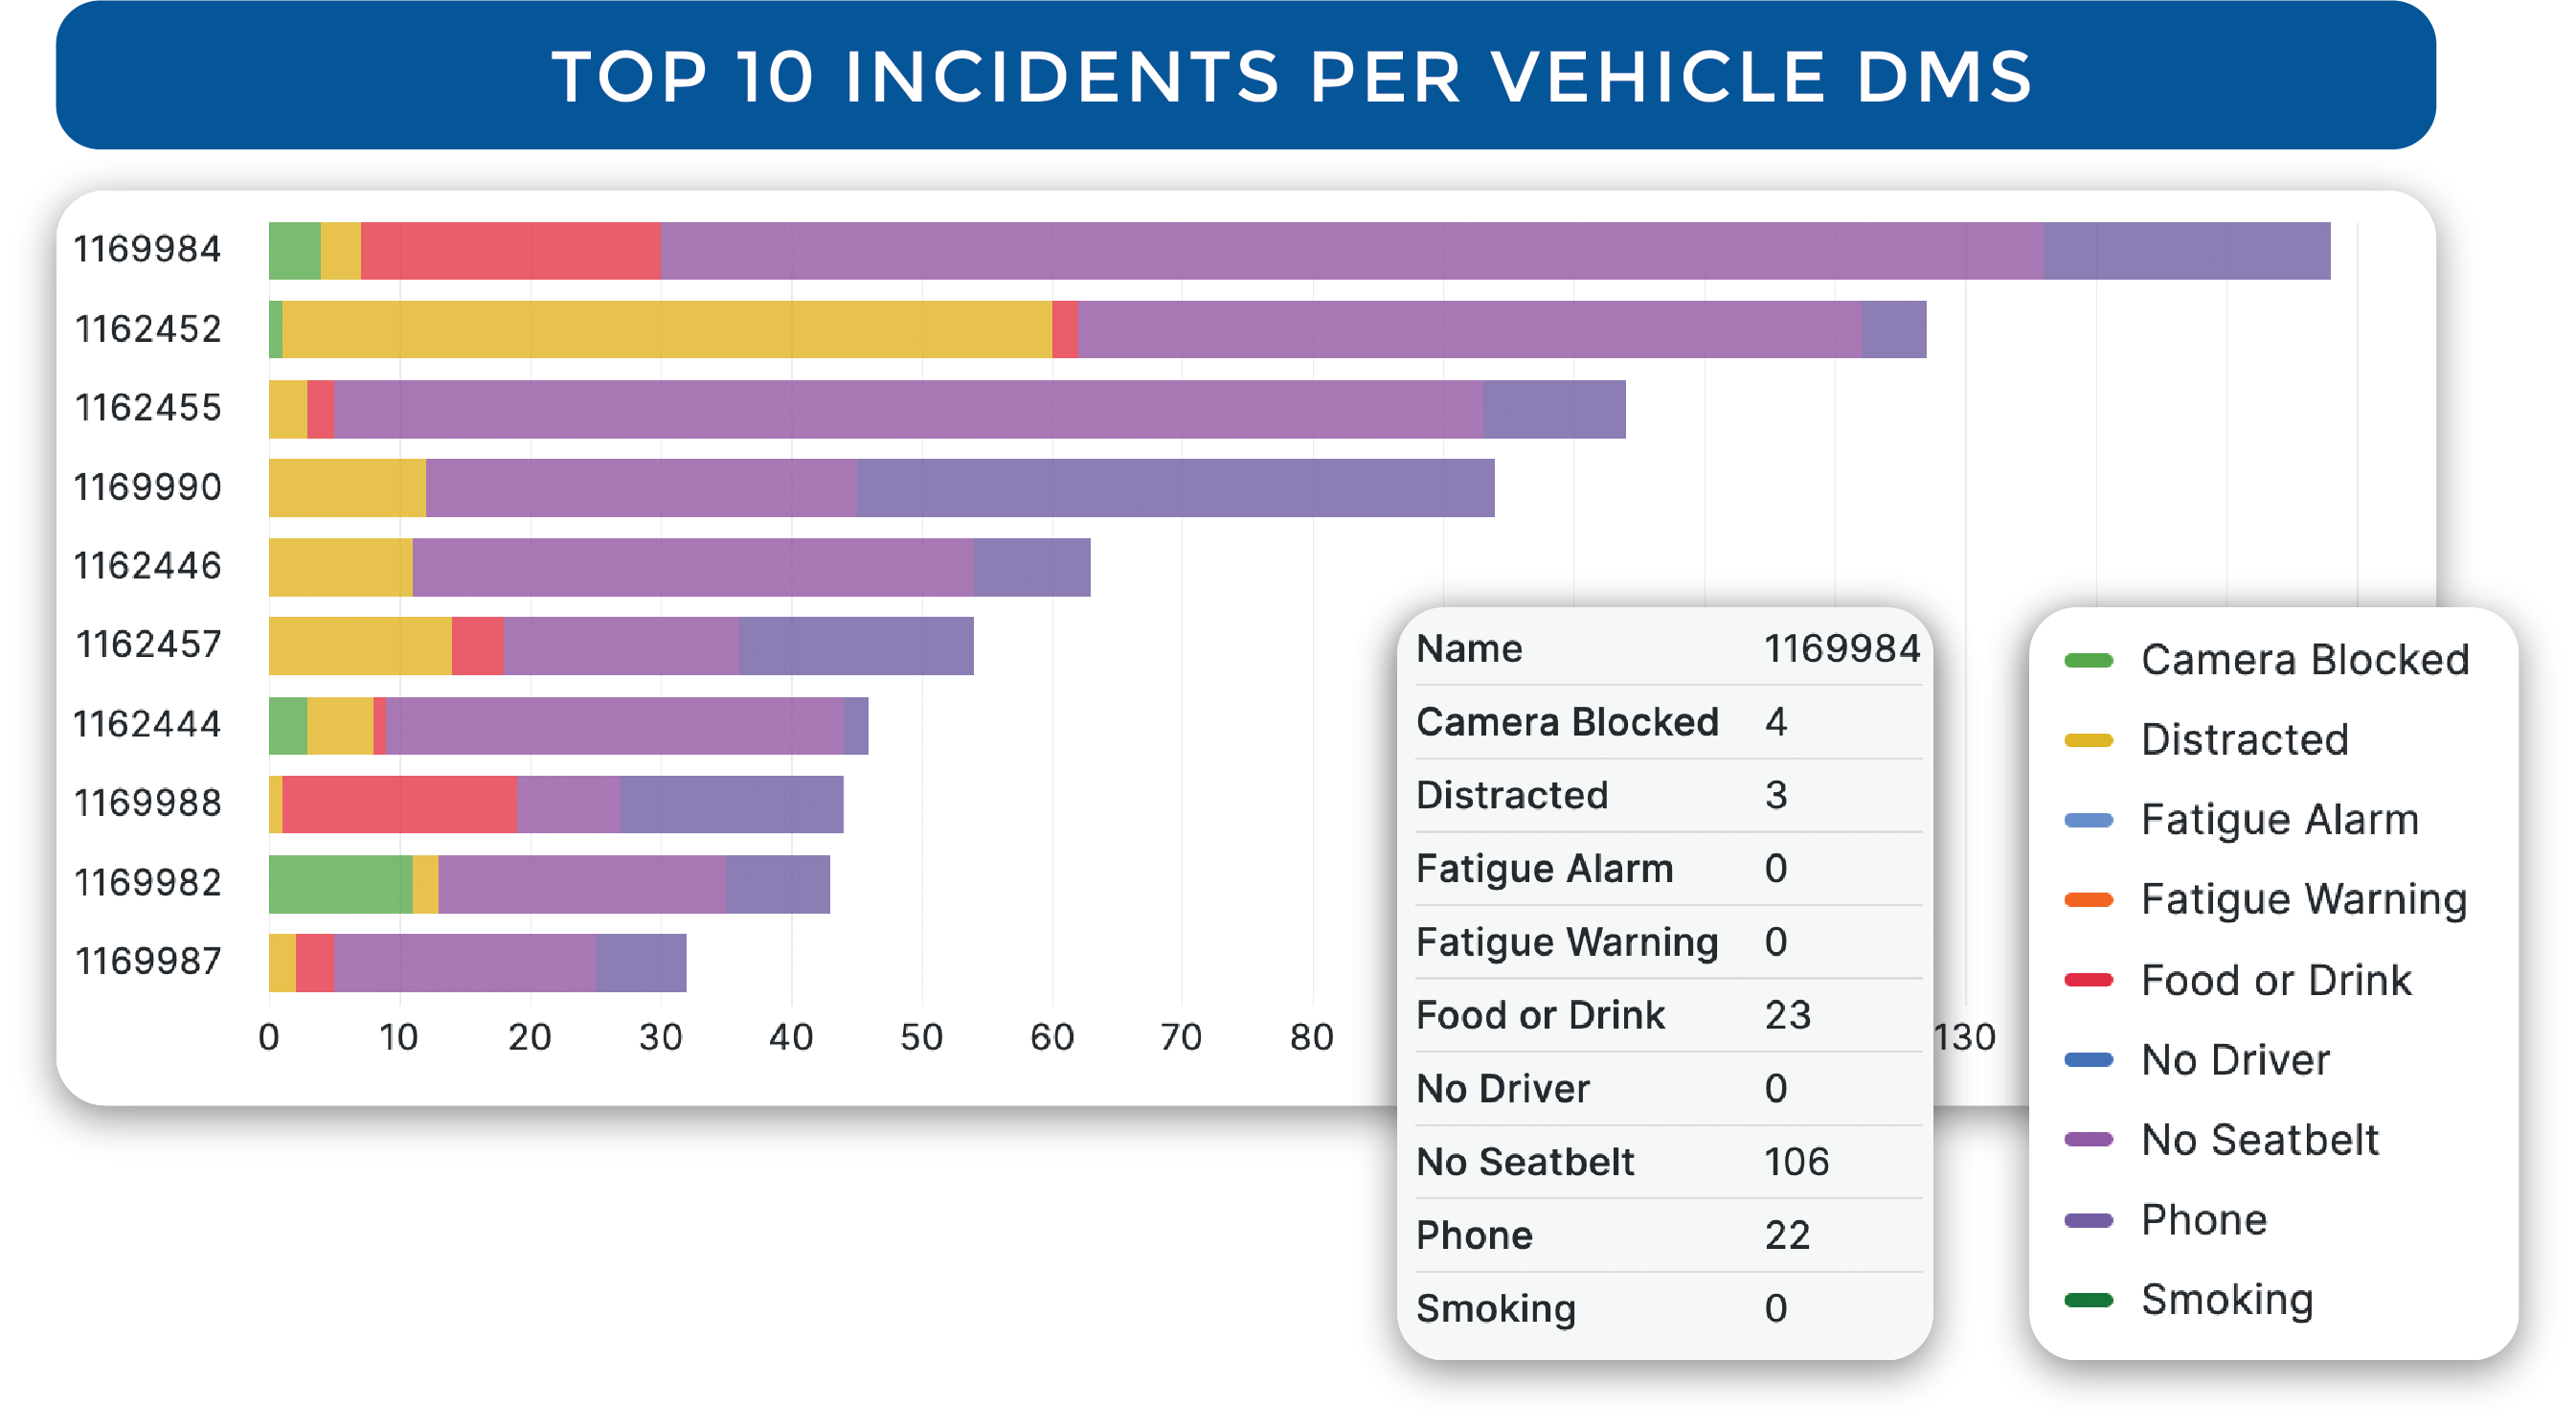
Targeted Intervention
Pinpoint safety challenges with top incident analysis, empowering targeted actions for enhanced fleet safety.
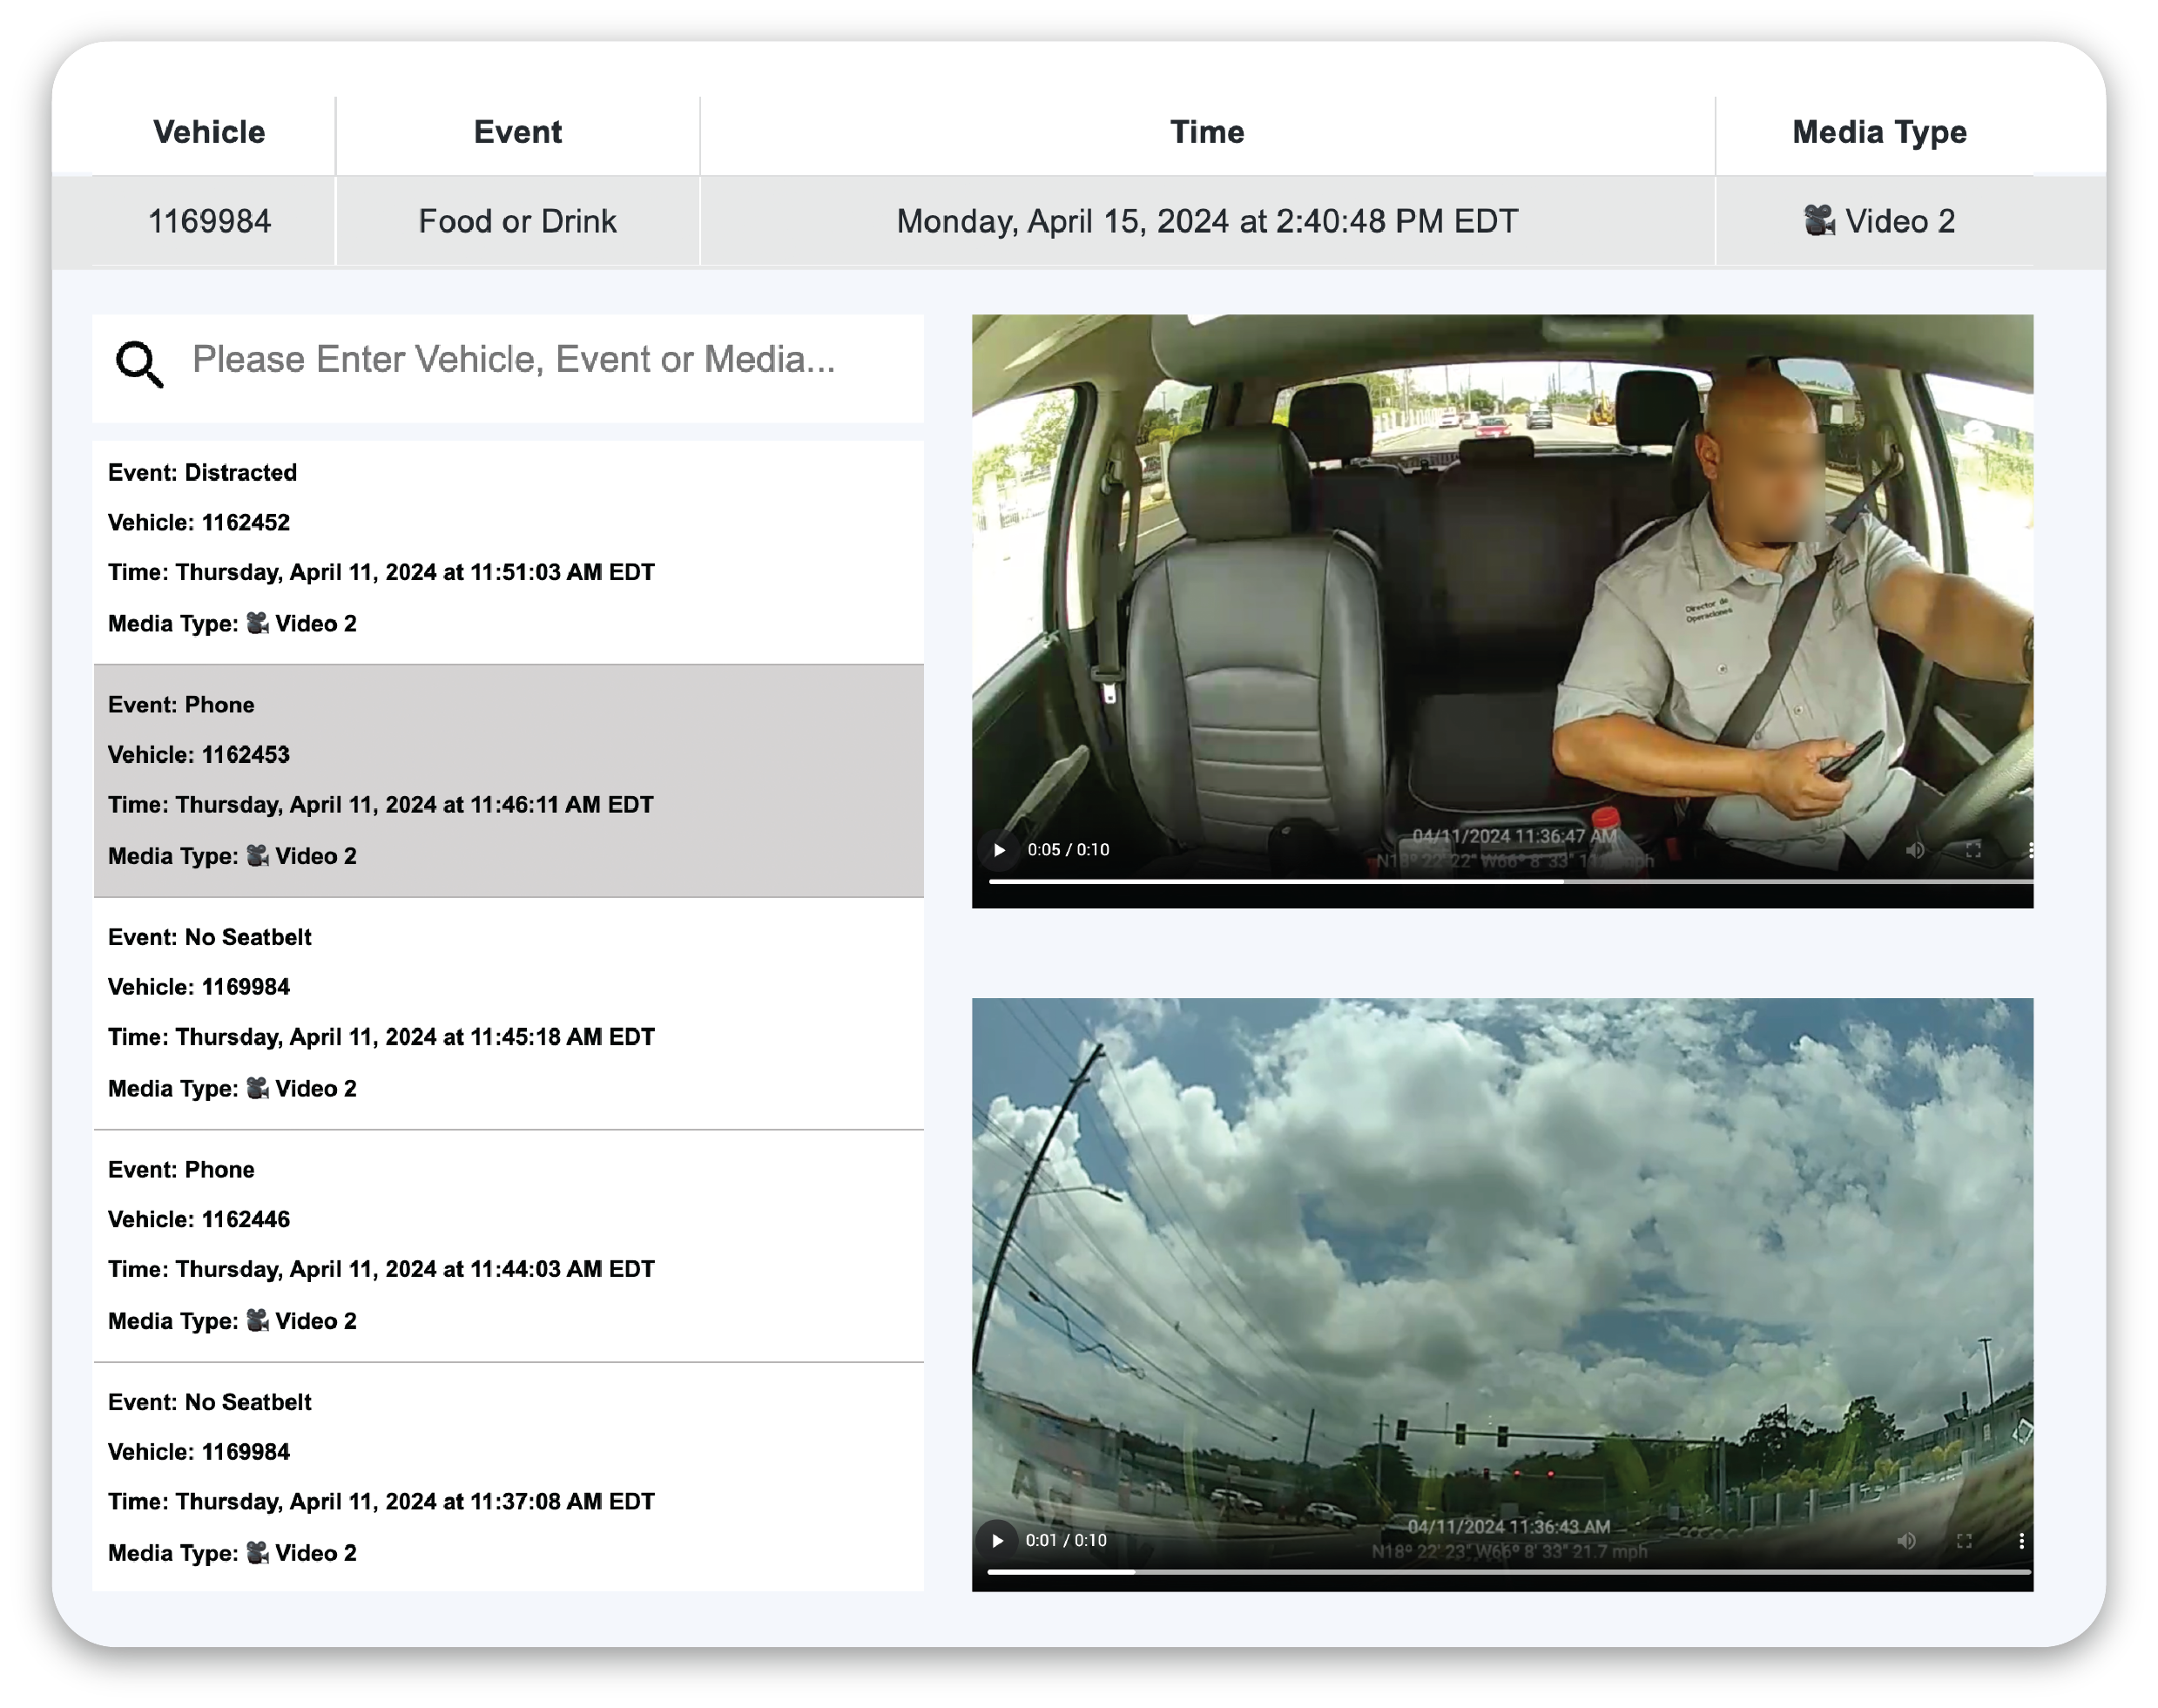
Streamline Incident Review
Access video recordings swiftly through our media viewer feature, facilitating quick resolutions and dispute handling.
Visualize Incident Patterns
Dive deep into incident data with intuitive pie charts, driving data-backed decisions to minimize risks.